Stockpile Volume Measurement with Mobile 3D Scanning - Dirt, Gravel, Mulch and Cut-and-Fill from a Phone
How much is in that pile? Laan Labs built a volume measurement tool into its mobile LiDAR scanning pipeline, so contractors, landscapers, aggregate yards and surveyors can measure stockpiles, excavations and fill in cubic yards and cubic meters with the phone in their pocket.

Business Challenge
"How much is in that pile?" is one of the most common measurement questions on a job site, and one of the hardest to answer well. A contractor needs to know how many truckloads of fill to order, or how much spoil has to be hauled away. A landscape supply yard sells mulch, topsoil and gravel by the cubic yard and has to know what is left in each bin. An aggregate producer reconciles stockpile inventory at month end and answers to an auditor. A municipality wants to know whether the road salt reserve will last the winter.
The traditional answers are a formula or a crew. Pacing out a pile and treating it as a cone or a prism is quick, but real piles are not cones, and the error is large enough to turn into an inventory write-off or a delivery dispute. A survey crew or a drone flight is accurate, but it has to be scheduled, it costs real money per visit, and the result arrives days later. In between, most piles are simply guessed.
Users of Laan Labs' consumer LiDAR scanning app had been asking for exactly this measurement. They were already scanning piles of gravel and dirt; they wanted the app to tell them the volume.
A walk around the pile with a phone, and a volume in cubic meters, cubic yards and cubic feet before the operator leaves the site
Approach: Scan, Outline, Measure
Laan Labs built a volume measurement tool directly into its mobile 3D scanning pipeline, and shipped it as the Volume Measure tool in its LiDAR scanning app in the spring of 2022. The same code has since been carried into the scanning frameworks Laan Labs licenses and the custom capture apps it builds for clients. The workflow is designed for the person who is already standing next to the pile with a phone or tablet.
A pile of gravel on a street reconstruction site, scanned with an iPhone LiDAR sensor in one pass around it
- Scan the pile. The operator walks around the stockpile with an iPhone Pro or iPad Pro, keeping the toe of the pile and the ground around it in view. The LiDAR mesh builds live on screen, so gaps are visible before the scan is finished. A truckload-sized pile takes well under a minute.
- Fit the base. The tool fits a base plane to the ground around the pile. A height map and contour lines show how the material sits above that plane, which makes an unlevel base or a missed section obvious.
- Outline the toe. The operator taps points around the bottom edge of the pile to close a polygon. The scan is clipped to that outline, so neighbouring piles, walls and equipment do not count.
- Read the volume. The mesh above the base is integrated and the result is shown in cubic meters, cubic yards and cubic feet.
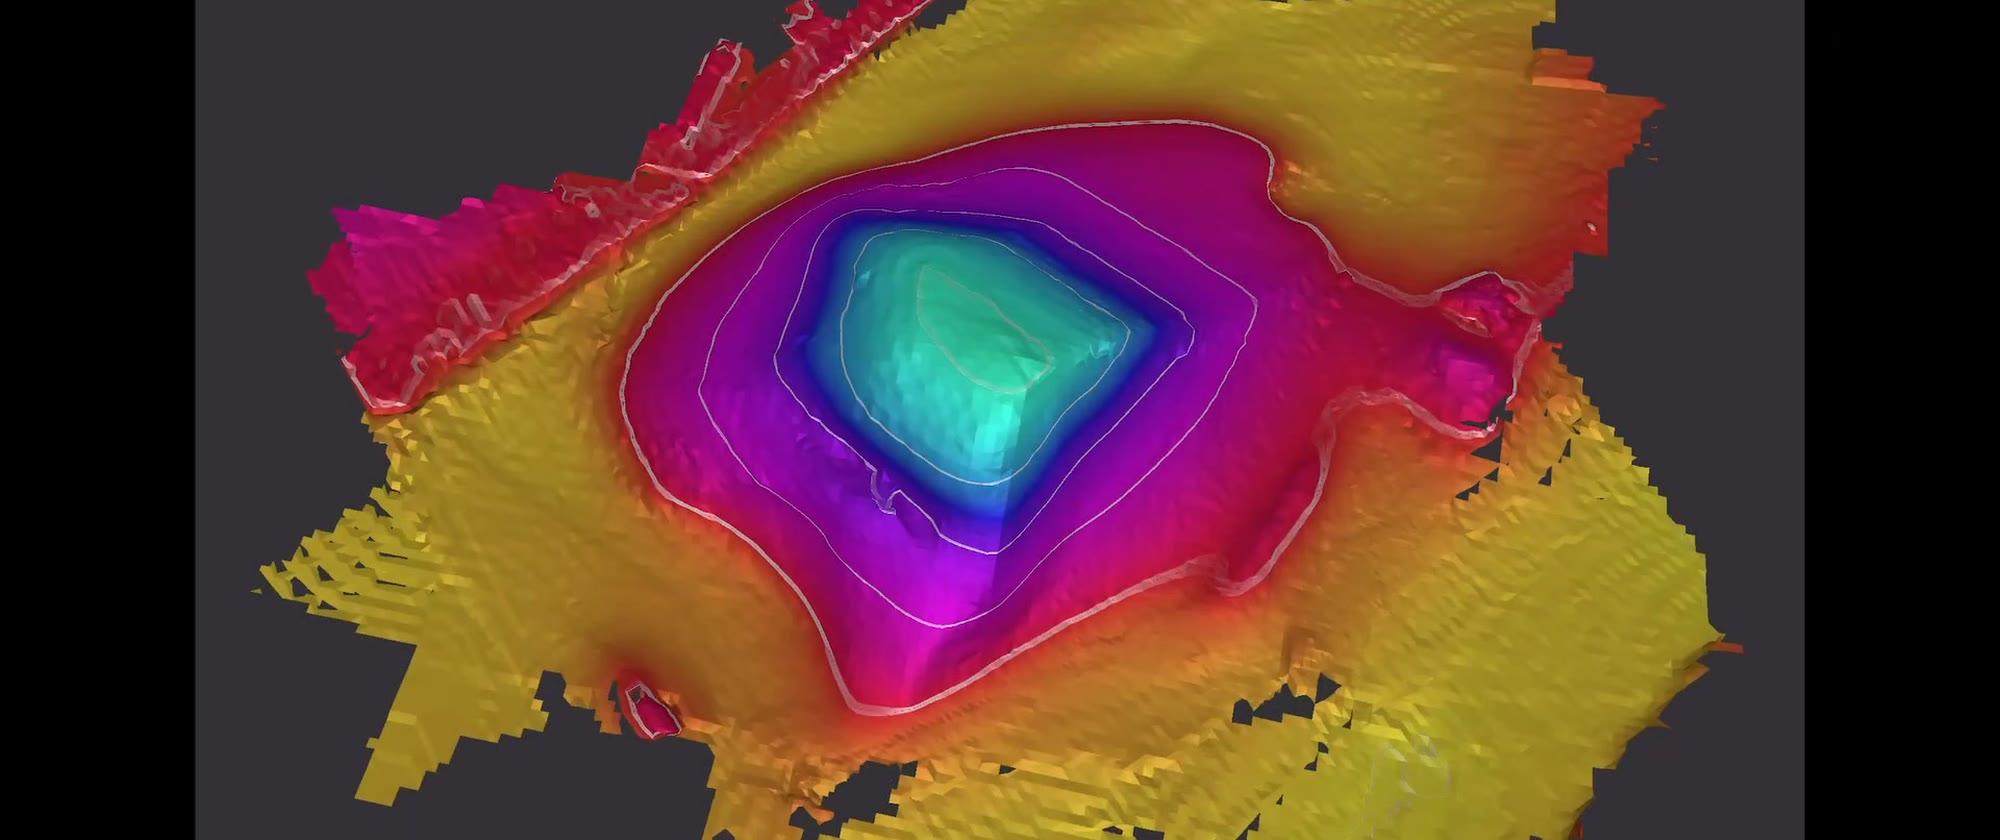
Height map and contours, the outline tapped around the toe, and the result: 7.33 cubic meters, or 9.59 cubic yards, for the pile in the video
The same tool works in the other direction. For a hole, a trench or a basement excavation, the plane is the original grade and the volume below it is the fill required, or the spoil removed. That turns a phone into a quick cut-and-fill check for small earthworks.
The clipped volume can be rotated and inspected, and the scan, outline and result are saved with the project
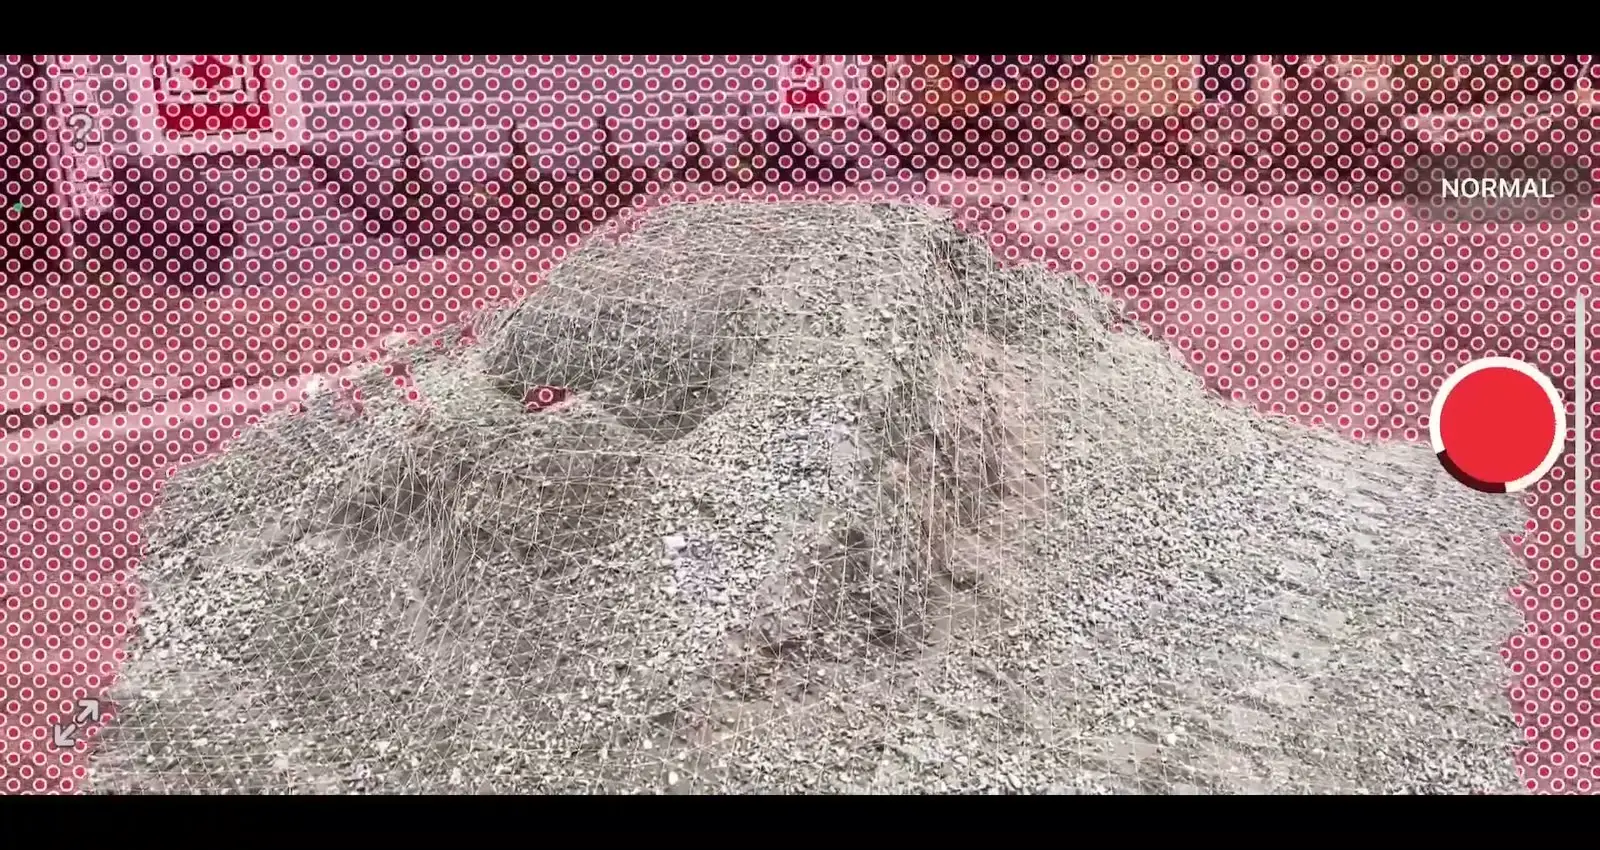
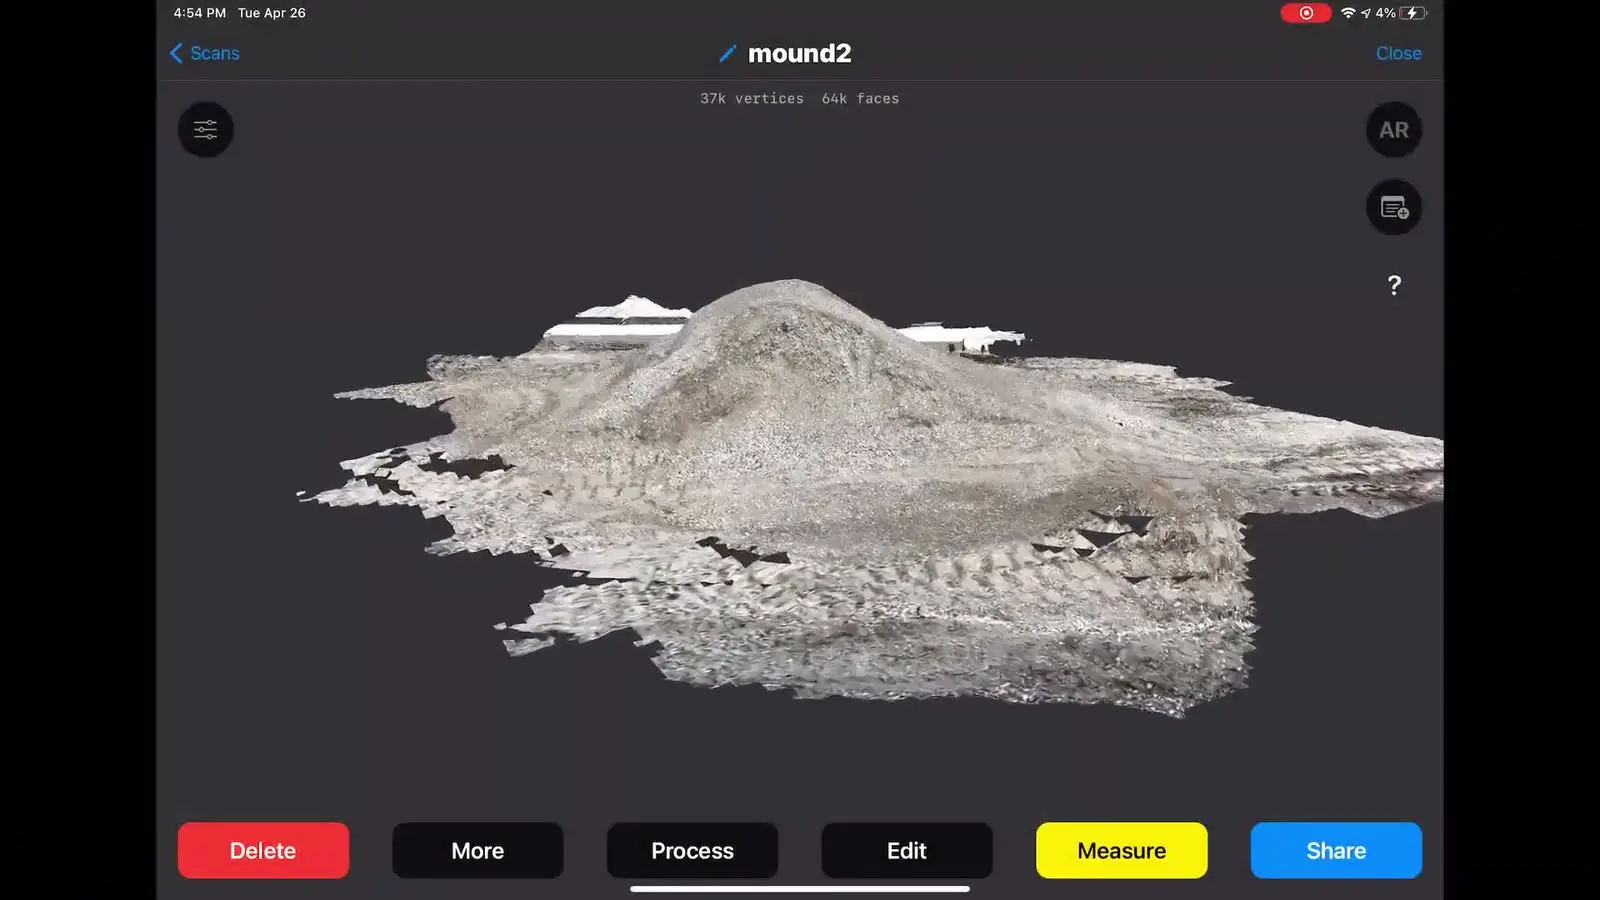
The mesh forming over the pile during the scan, and the finished textured mesh
From Cubic Yards to Tons
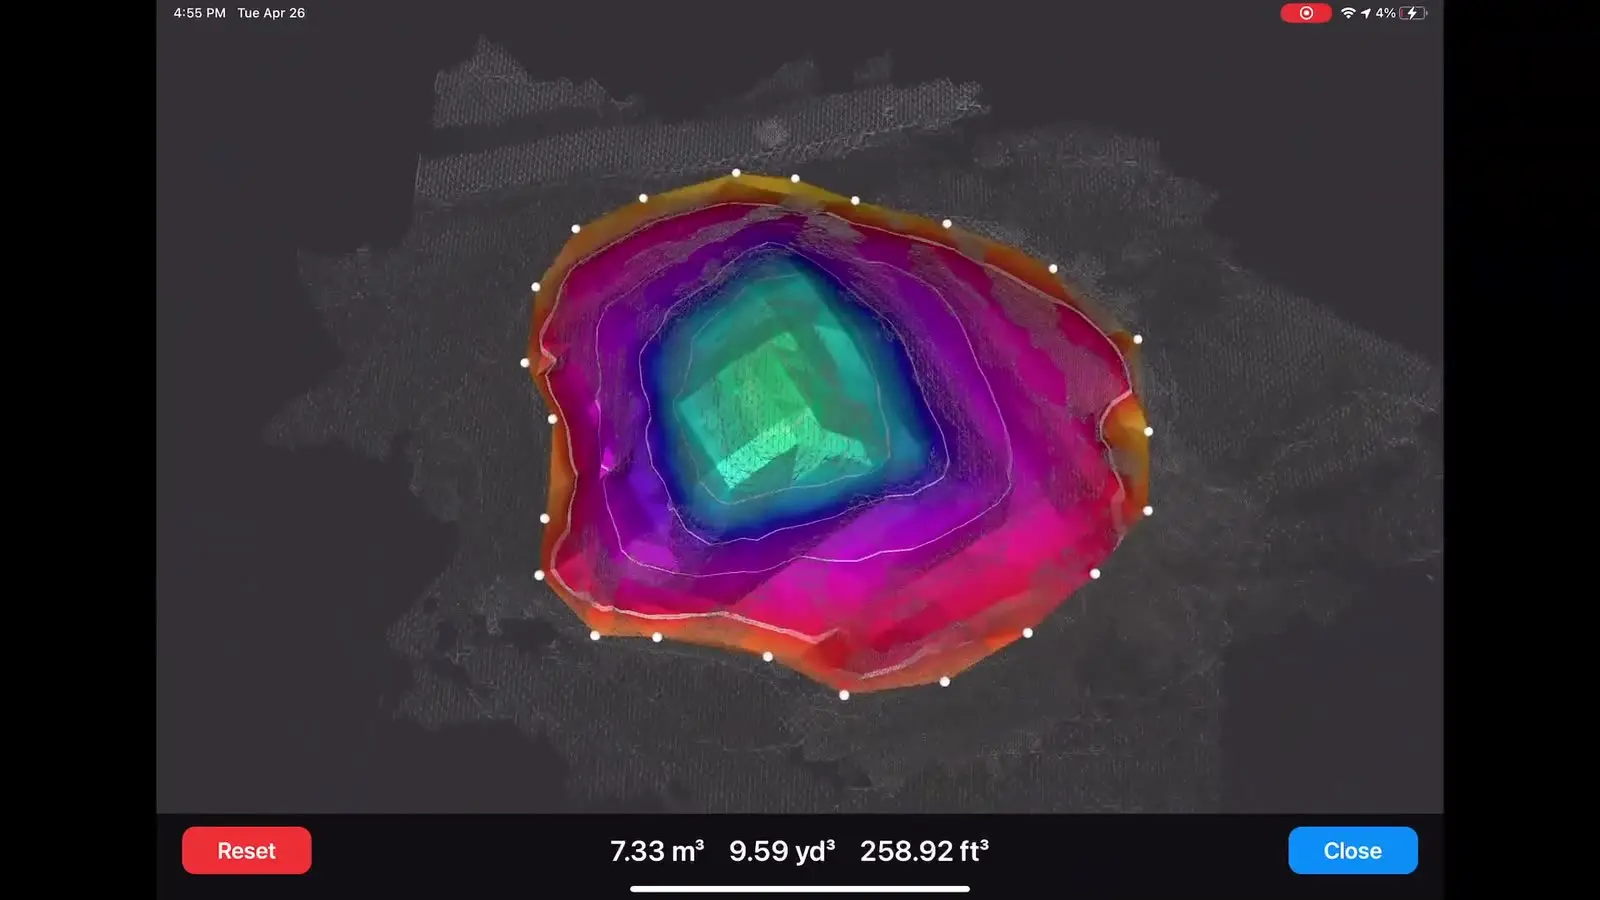
The result for the pile in the video: 7.33 cubic meters, 9.59 cubic yards, 258.92 cubic feet
Volume is what the scan measures; tonnage is what most people buy, sell and report. The tool reports volume, and the conversion is a density factor per material. The ranges below are typical figures from published bulk-density tables for loose material. Moisture, gradation and compaction move them, so a yard that sells by weight should use its own factor, checked against weigh tickets.
| Material | Tonnes per m³ (typical) | US tons per yd³ (typical) |
|---|---|---|
| Crushed stone, gravel, aggregate | 1.5 to 1.7 | 1.3 to 1.45 |
| Sand, dry to damp | 1.4 to 1.7 | 1.2 to 1.45 |
| Topsoil and fill dirt, loose | 1.1 to 1.4 | 0.95 to 1.2 |
| Asphalt millings, loose | 1.2 to 1.5 | 1.0 to 1.25 |
| Recycled concrete aggregate | 1.3 to 1.6 | 1.1 to 1.35 |
| Road salt | 1.0 to 1.2 | 0.85 to 1.0 |
| Coal, loose | 0.75 to 0.95 | 0.65 to 0.8 |
| Compost | 0.5 to 0.7 | 0.4 to 0.6 |
| Mulch and wood chips | 0.25 to 0.45 | 0.2 to 0.4 |
In a custom pipeline the factor lives with the material or SKU, so a measurement of a stockpile of three-quarter-inch crushed stone comes back in tons as well as cubic yards, and a month of measurements can be totalled by product and by site.
Who Measures Piles, and What They Measure
The volume question comes up across industries, and the material changes what the measurement is for.
Aggregates, Quarries and Recycling Yards
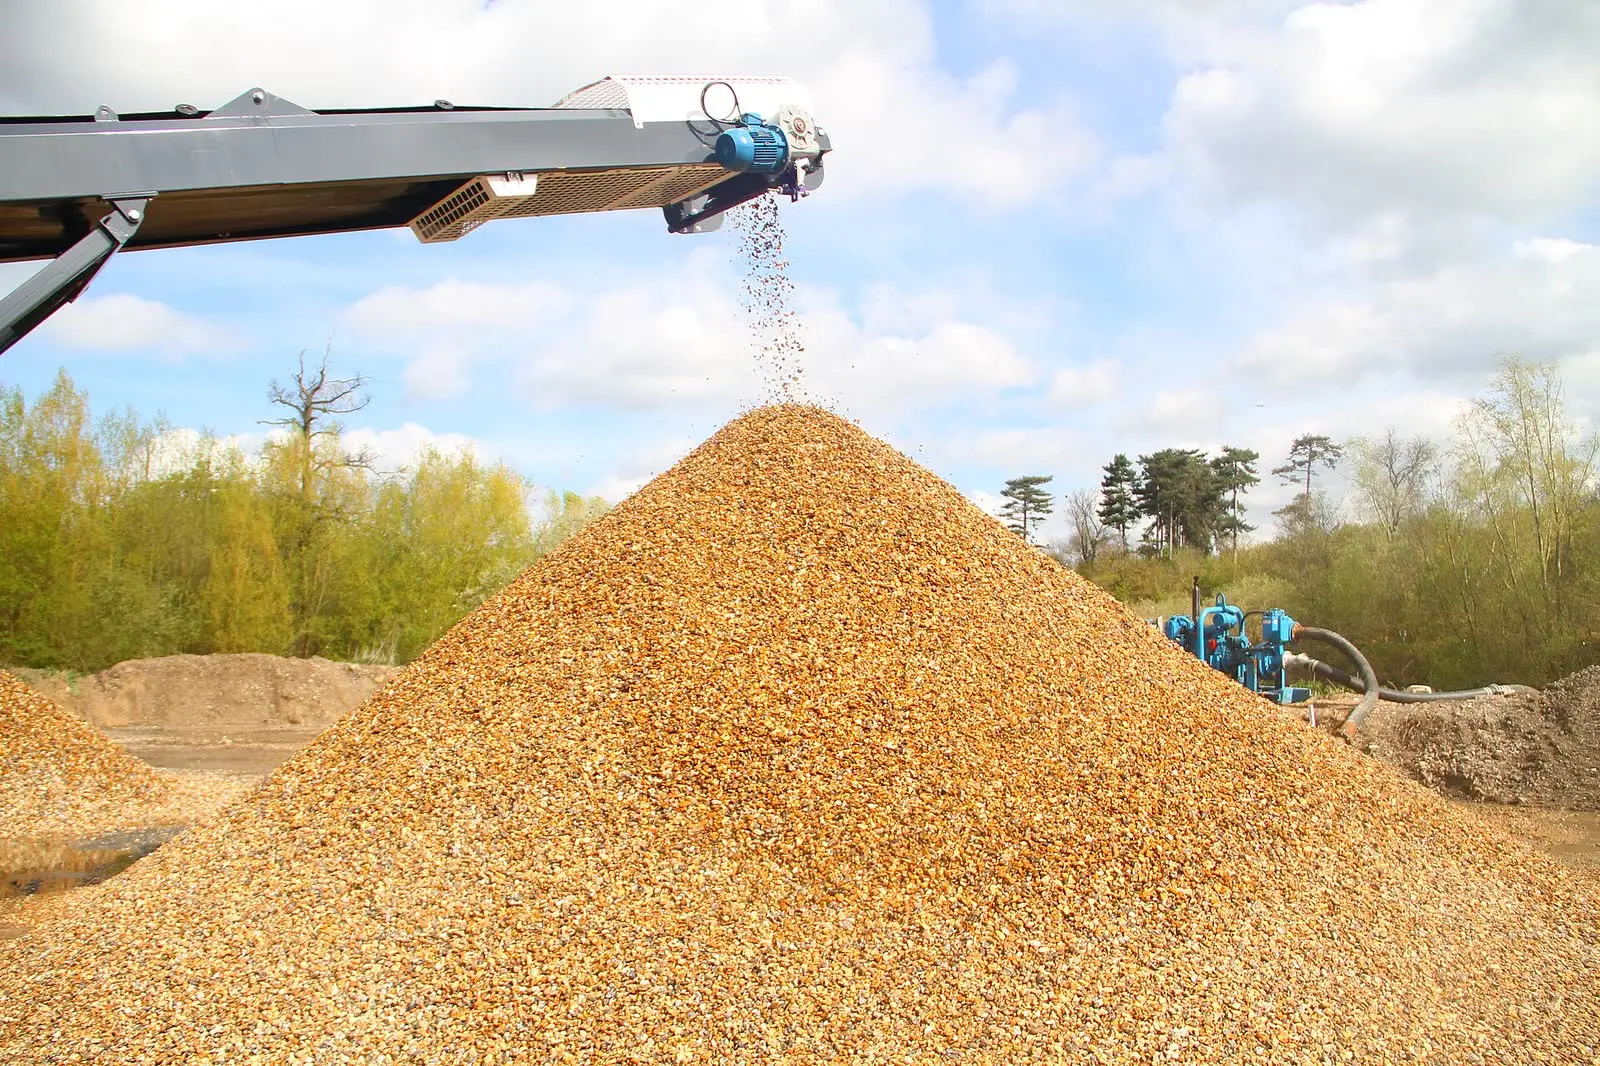
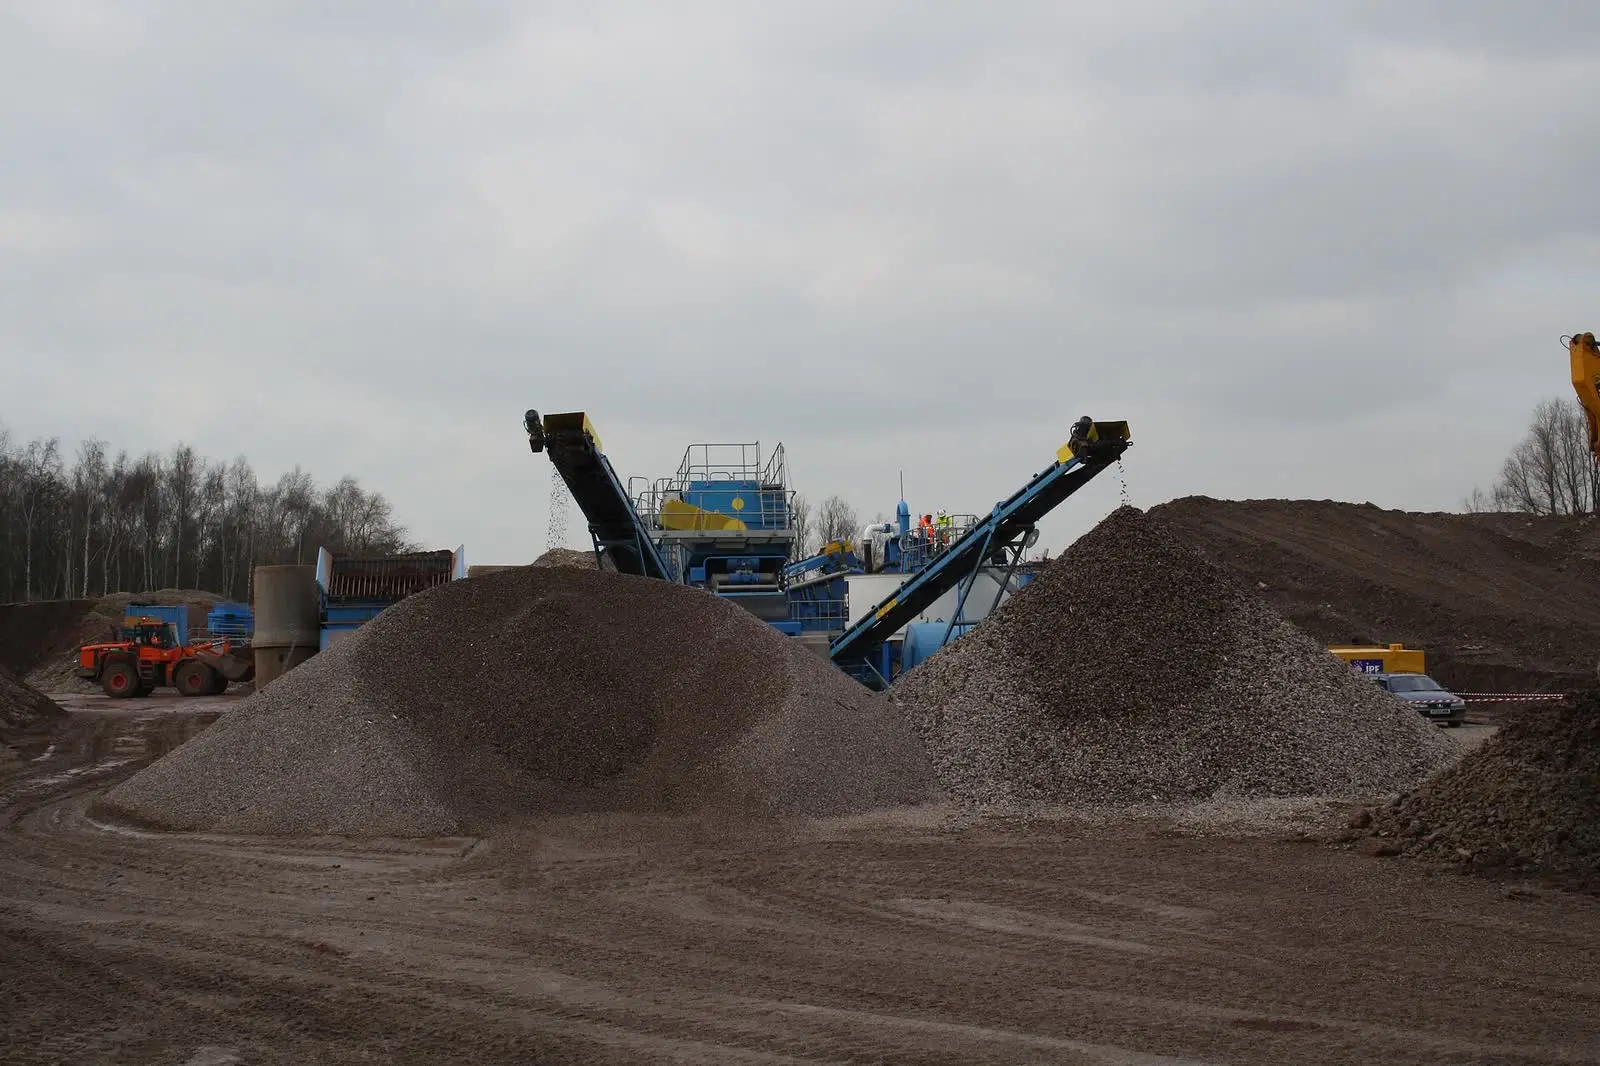
Aggregate stockpiles at a plant and at a recycling yard. Photos: Peter Craven, Wikimedia Commons (conveyor, recycled aggregate), CC BY 2.0. Shown for illustration; not Laan Labs projects.
.jpg)
.jpg)
Crushed stone, gravel, sand, recycled concrete and asphalt millings are inventory. Producers and recyclers measure stockpiles for month-end and year-end inventory counts, to find shrinkage between what was produced and what was shipped, to settle disputes over deliveries in and out, and to answer auditors who no longer accept a walk-around estimate. A phone scan lets a yard manager measure the piles that changed this week instead of waiting for the quarterly survey.
Construction and Excavation
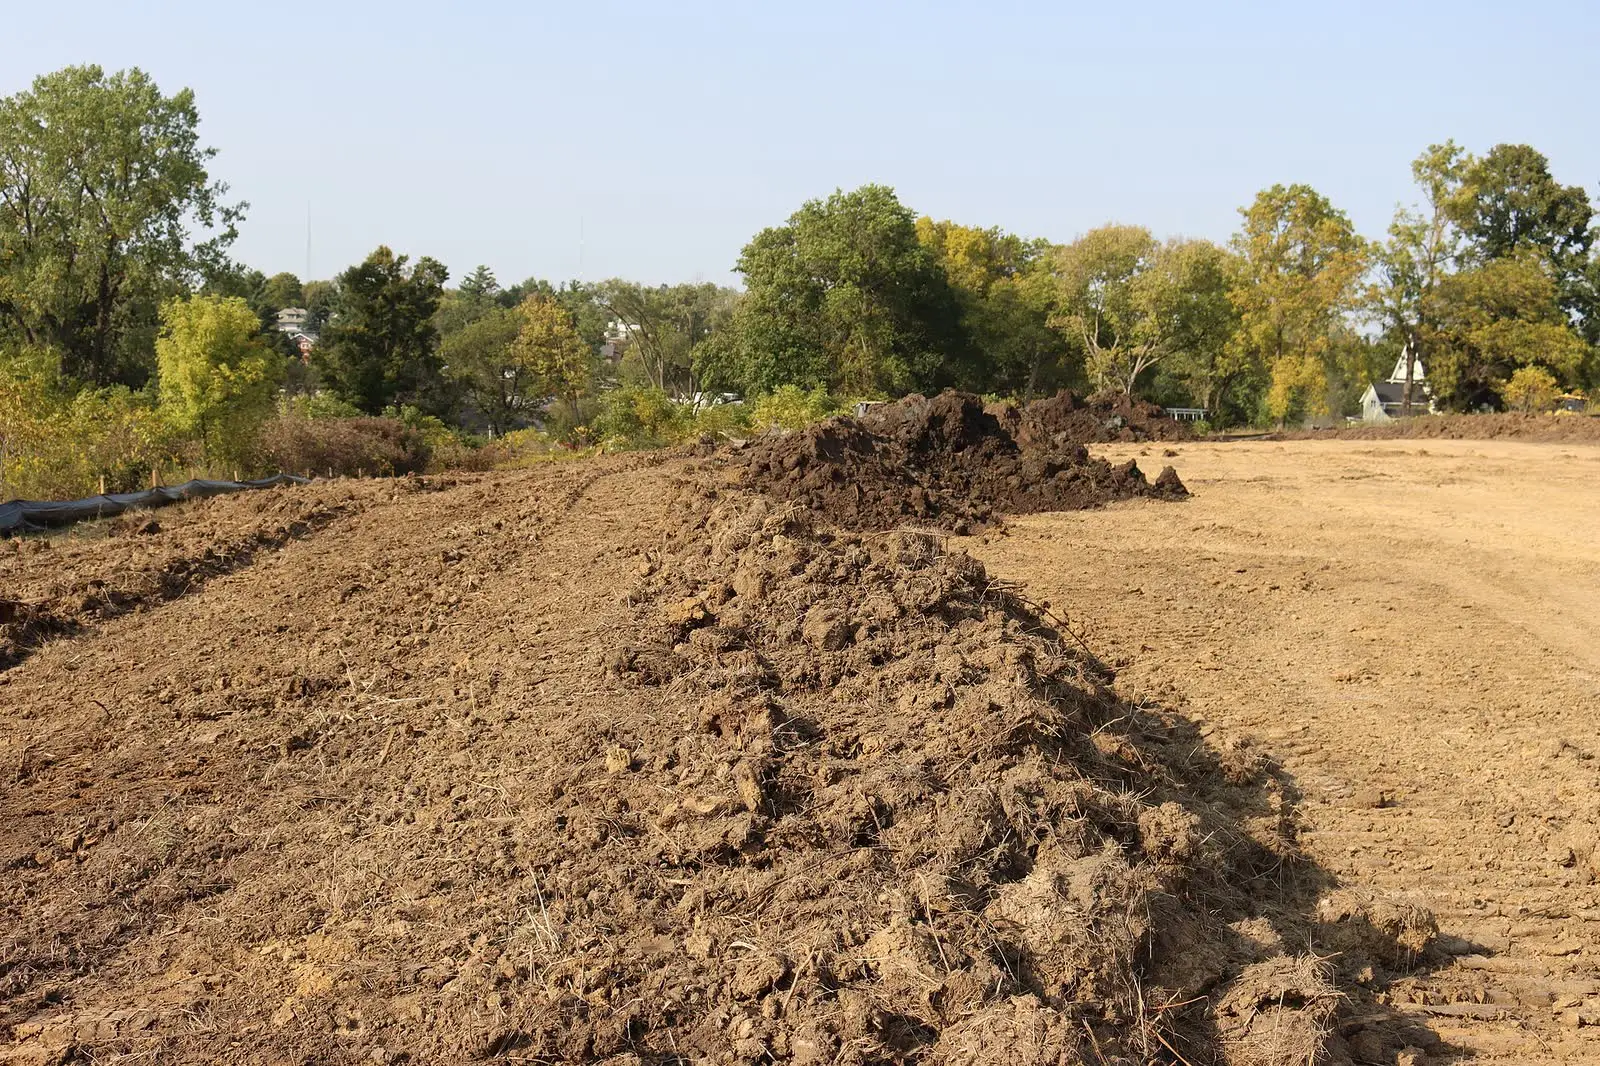
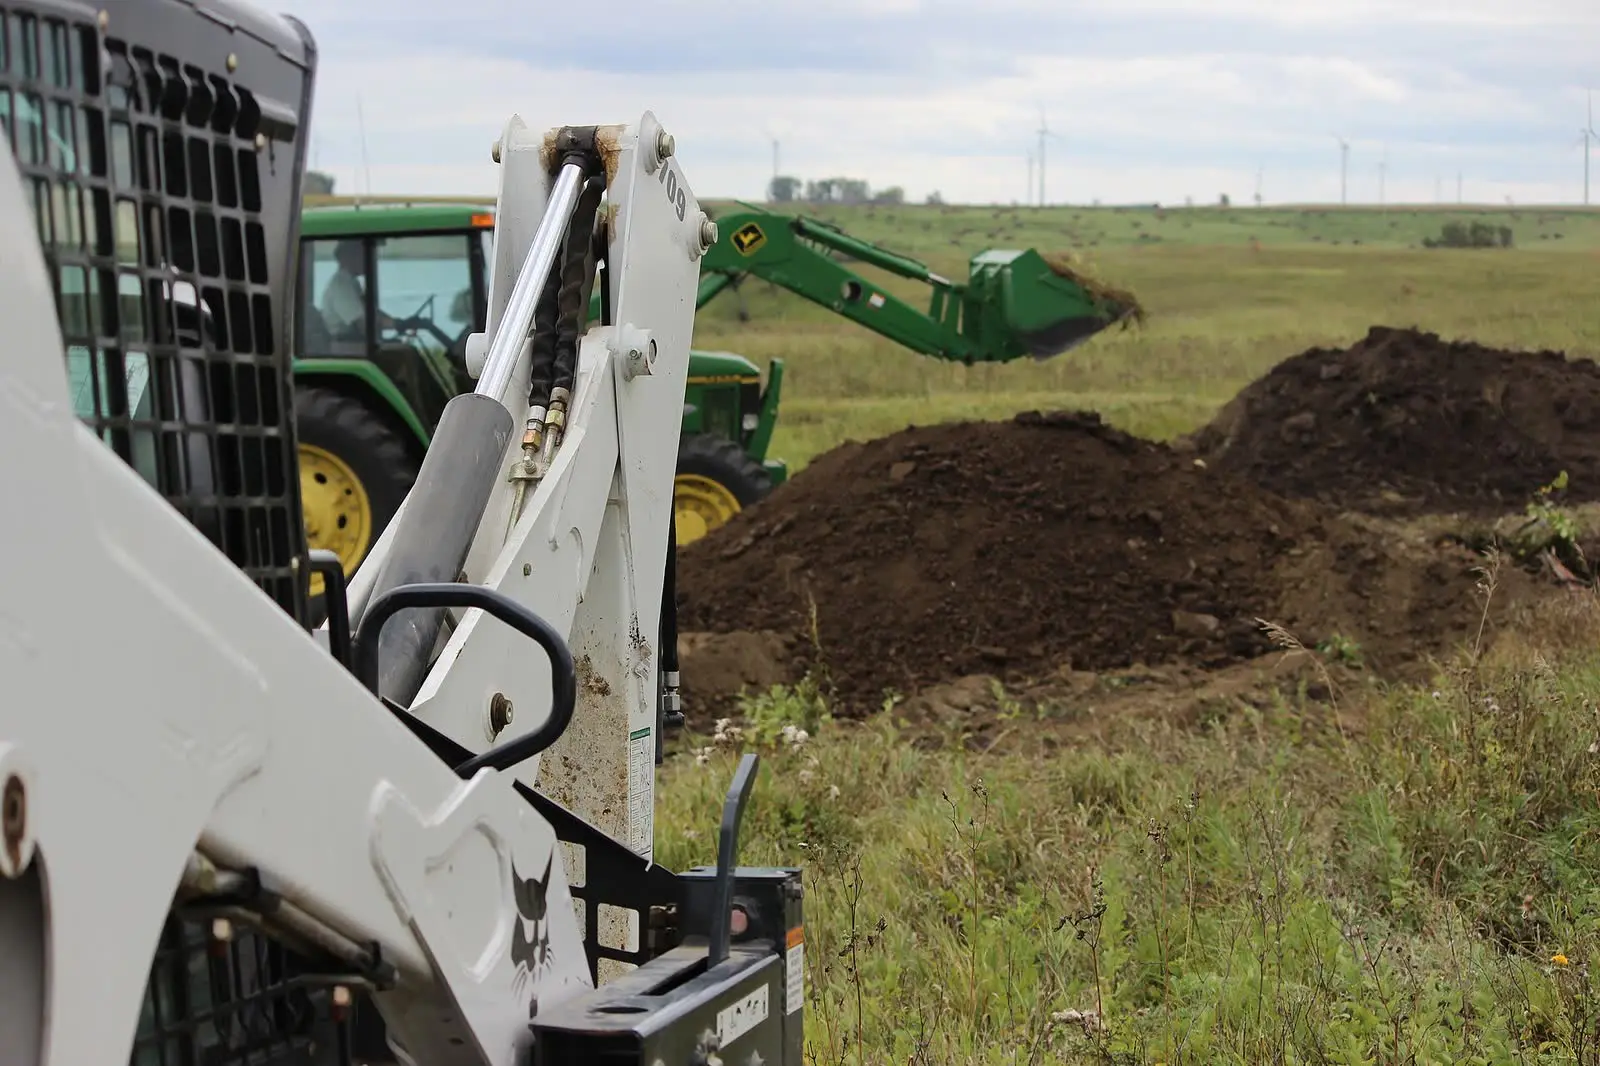
Excavated soil and fill on site. Photos: National Park Service, Wikimedia Commons, public domain; U.S. Fish and Wildlife Service, Wikimedia Commons, public domain. Shown for illustration; not Laan Labs projects.
.JPG)
.jpg)
On a job site the questions are about movement: how much spoil came out of the excavation and has to be hauled off, how much fill or base course to order for a pad, a driveway or a trench backfill, and whether the number of truckloads invoiced matches the pile on the ground. Scanning the pile or the hole gives a cut-and-fill figure that a site supervisor can check against the quantity on the ticket. For larger earthworks the same measurement runs on a drone photogrammetry capture, described below.
Landscaping and Bulk Material Supply
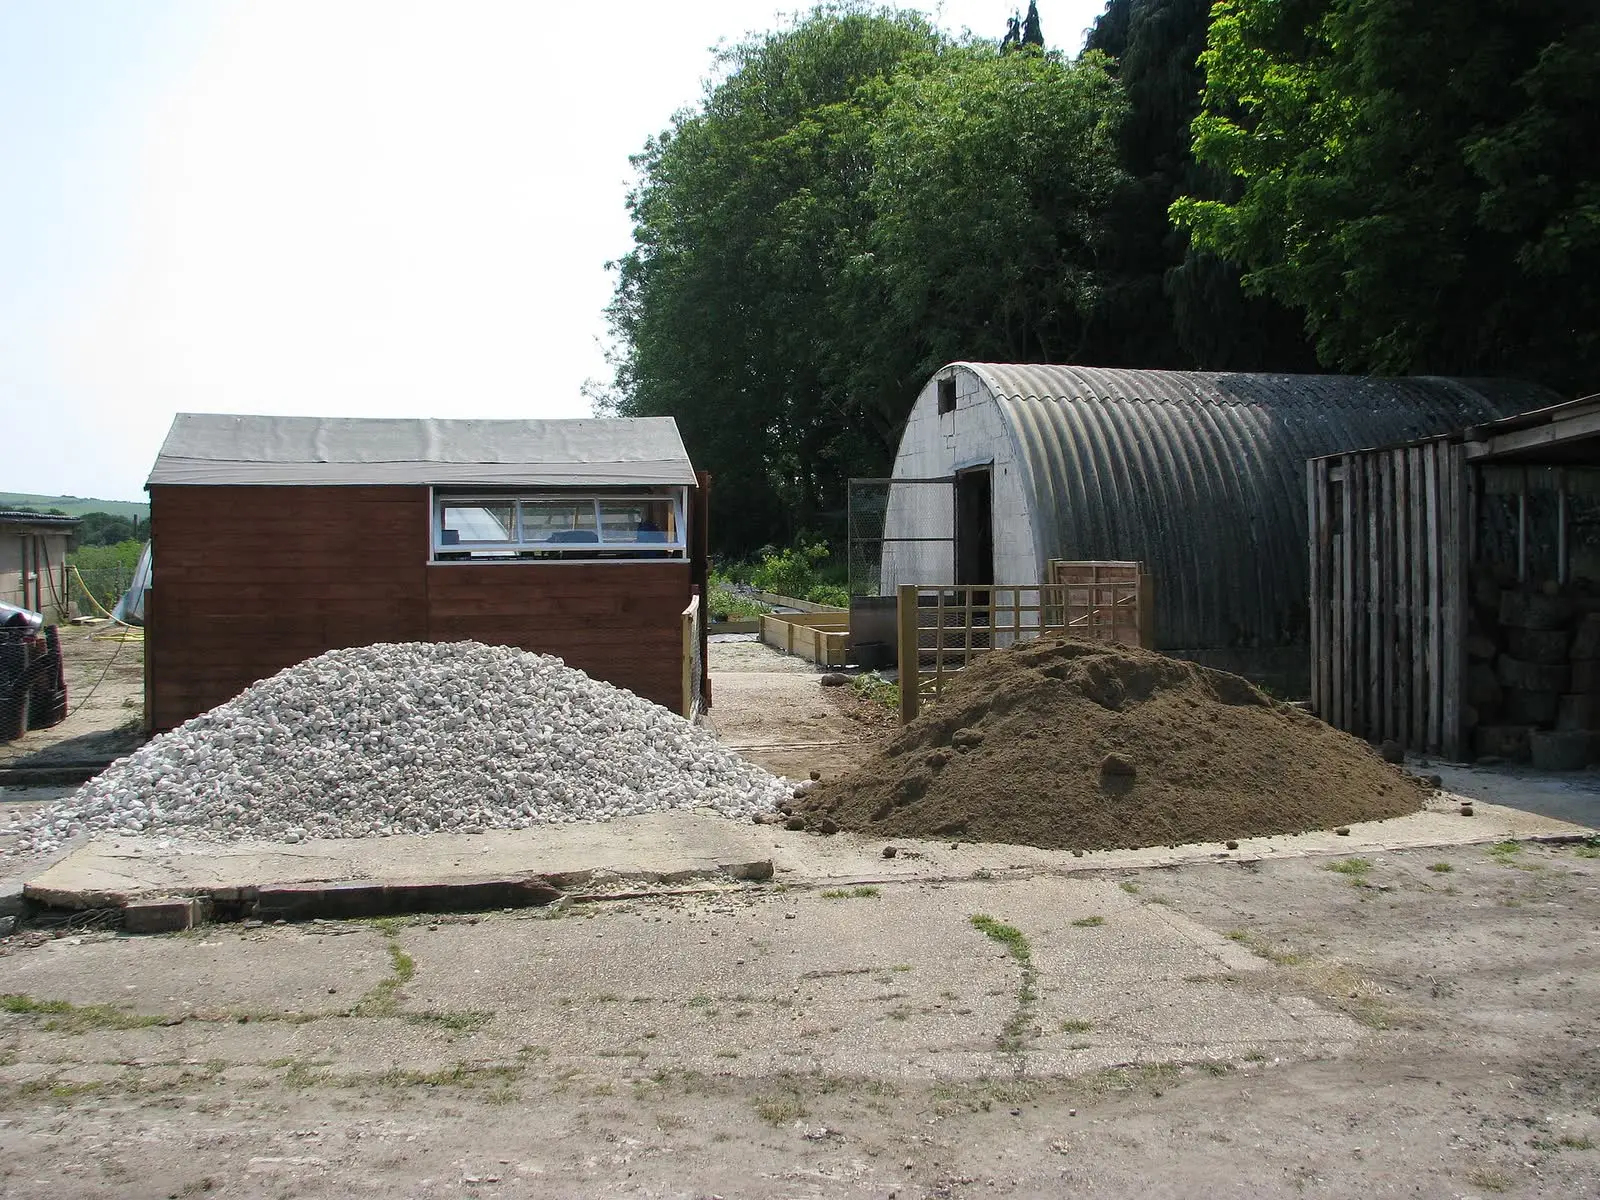
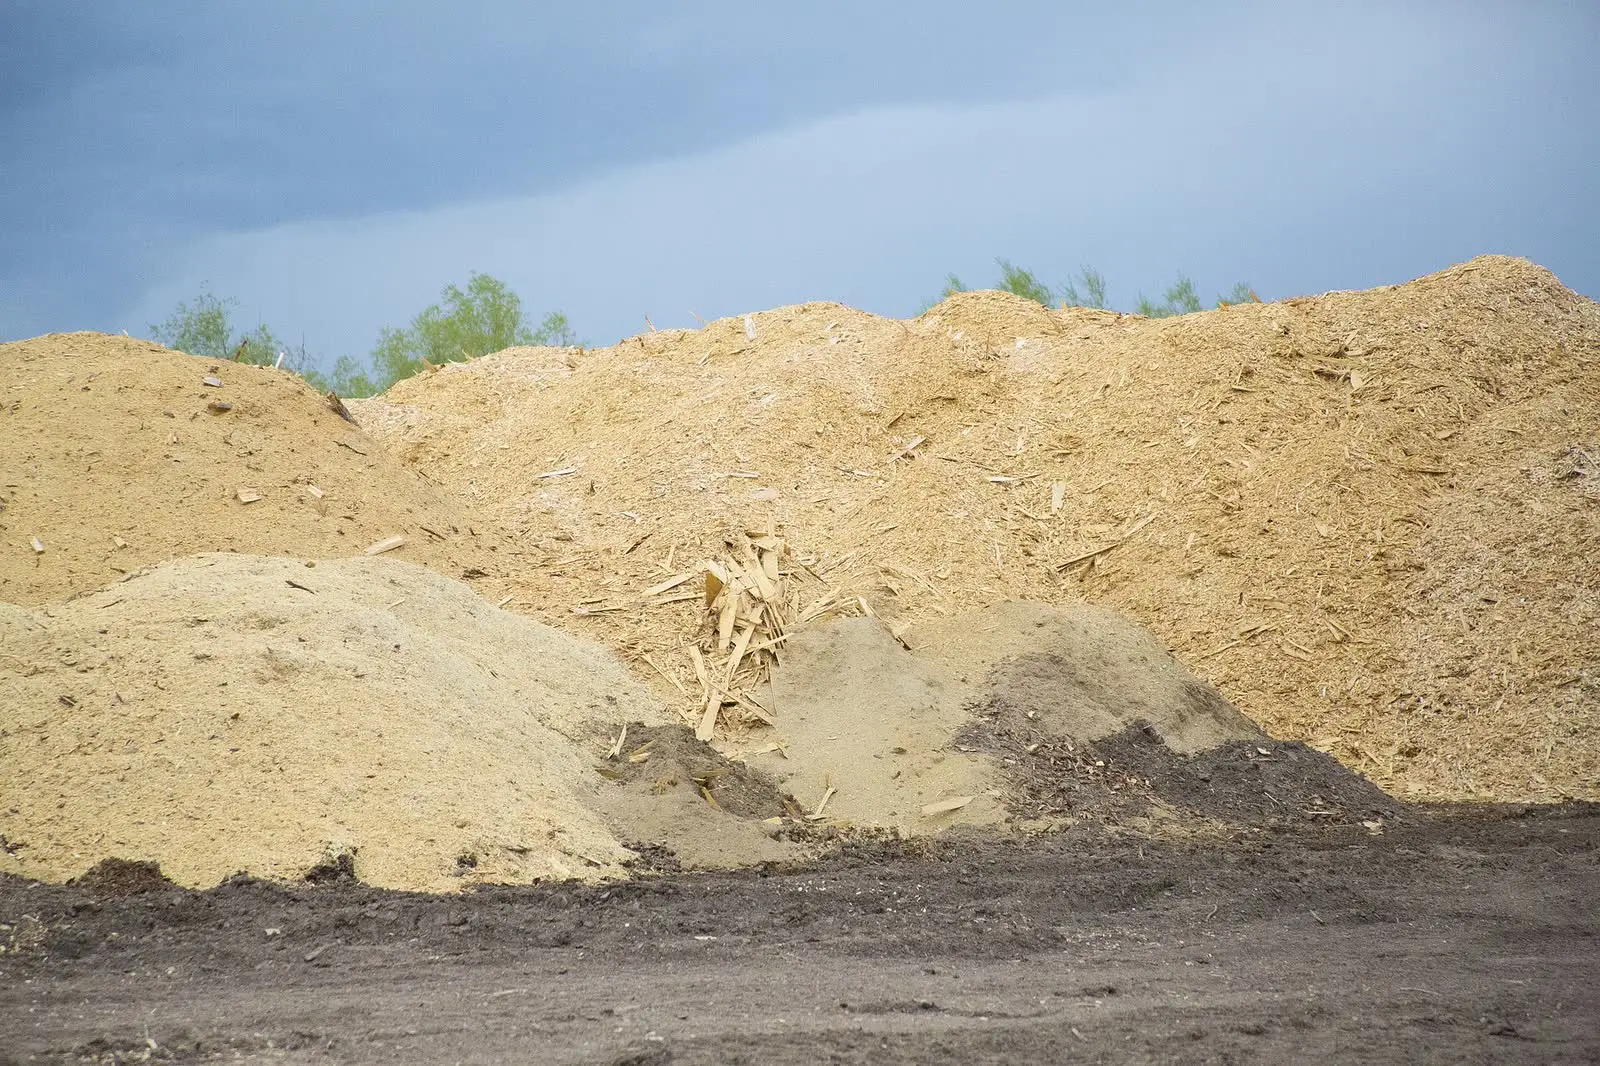
A supply yard and a wood-chip pile. Photos: peganum, Wikimedia Commons, CC BY-SA 2.0; USDA Forest Service, Wikimedia Commons, public domain. Shown for illustration; not Laan Labs projects.

.jpg)
Mulch, bark, wood chips, compost, topsoil, garden soil blends, decorative stone and pea gravel are sold by the cubic yard, often from bins and bunkers at a garden center or landscape supply yard. Knowing what is left in each bin drives reordering and stops a yard selling material it no longer has. A delivered load can be scanned on the customer's driveway to confirm the yards that were paid for.
Road Maintenance and Municipal Works
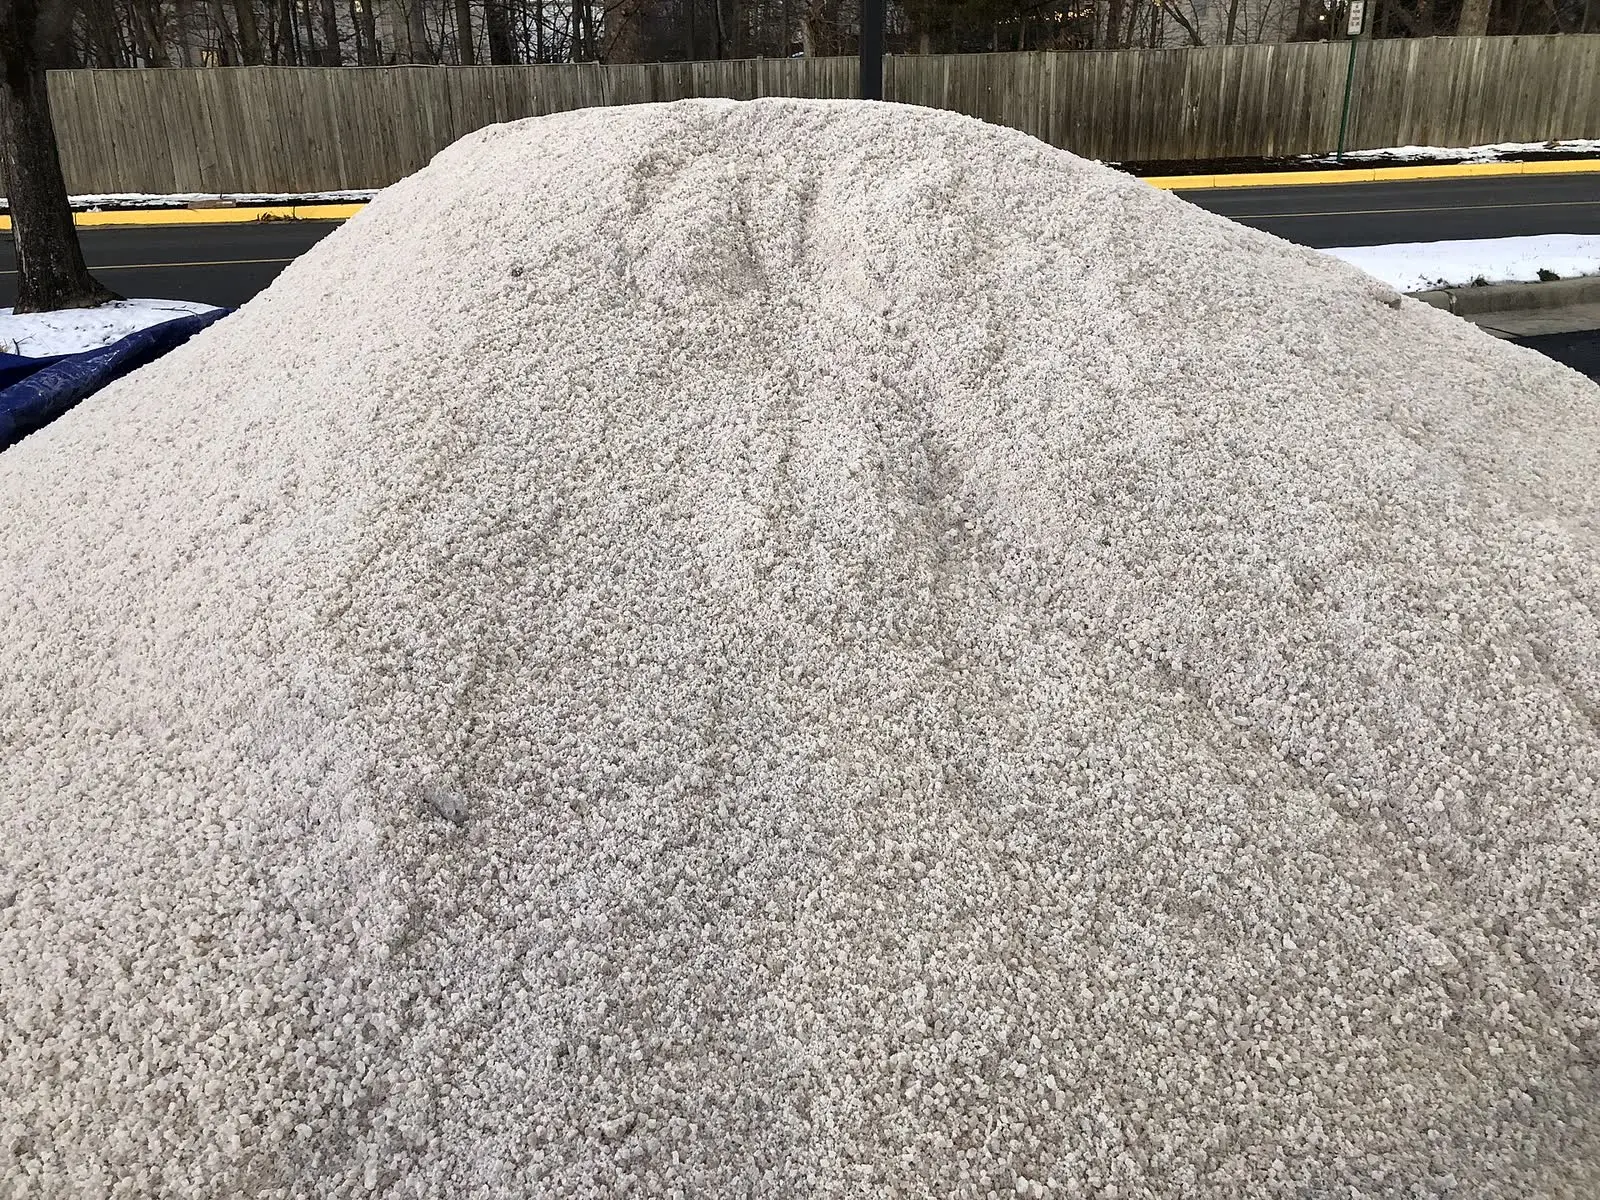
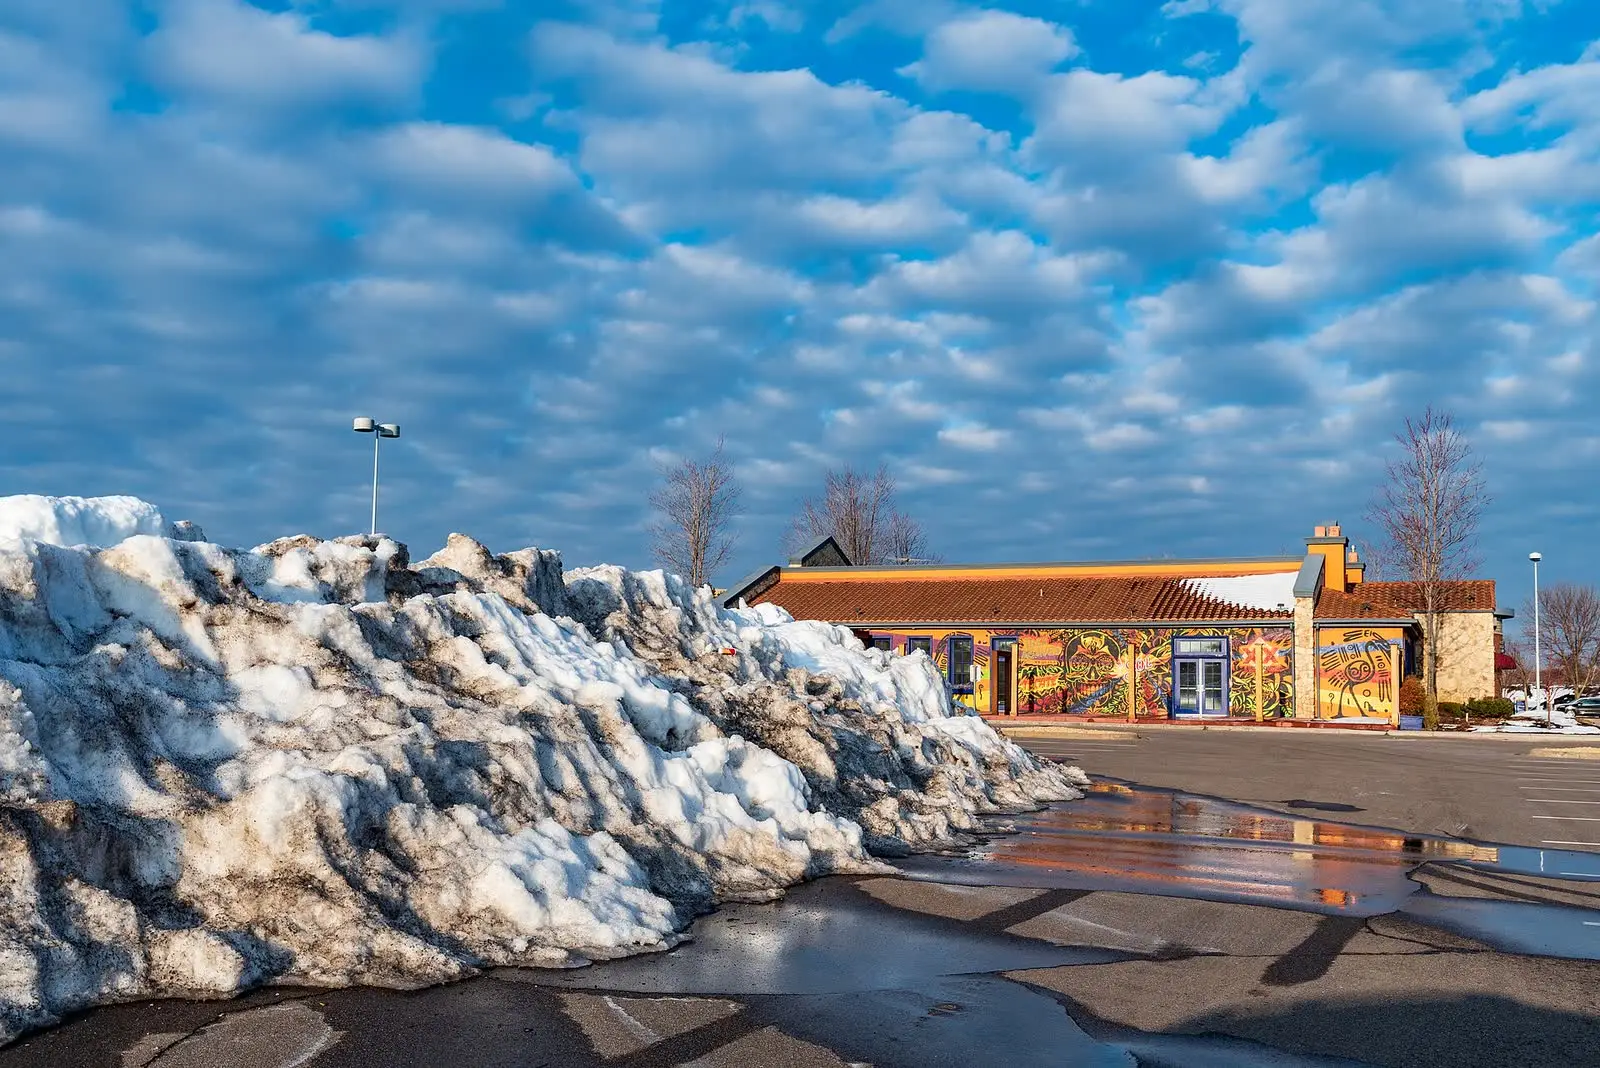
Road salt and a plowed snow pile. Photos: Famartin, Wikimedia Commons, CC BY-SA 4.0; Tony Webster, Wikimedia Commons, CC BY 2.0. Shown for illustration; not Laan Labs projects.

.jpg)
Public works departments and contractors measure road salt and sand reserves under a salt dome or shed before a storm, snow piles that a hauling contract pays for by the load, millings stockpiled from a resurfacing job, and the gravel reserved for a road maintenance season. These are the piles that are measured a few times a year, by whoever is on shift, which is exactly the situation a phone-based tool is built for.
Energy, Mining and Agriculture
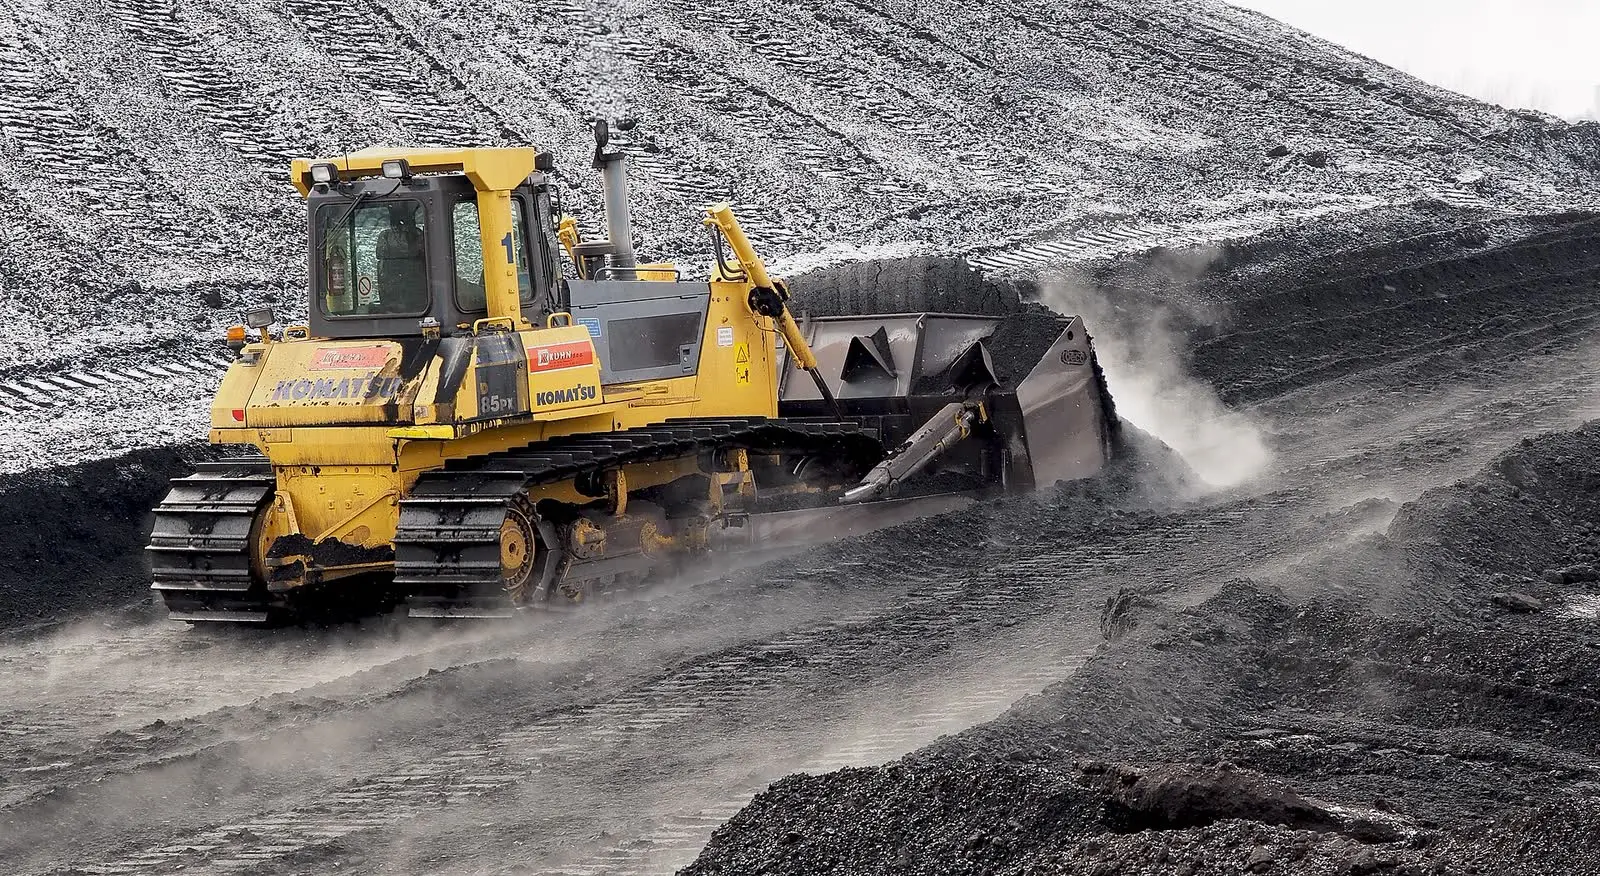
A coal stockpile at a power plant. Photo: Petar Milošević, Wikimedia Commons, CC BY-SA 4.0. Shown for illustration; not a Laan Labs project.
.jpg)
Coal, biomass, ore, fertilizer, grain and feed are stored in bulk and measured for stock accounting and production monitoring. Many of these piles are too large or too hazardous to walk around with a phone, and that is where the pipeline switches to drone or fixed-camera capture with the same measurement on the result.
Accuracy, and When a Phone Is Not Enough
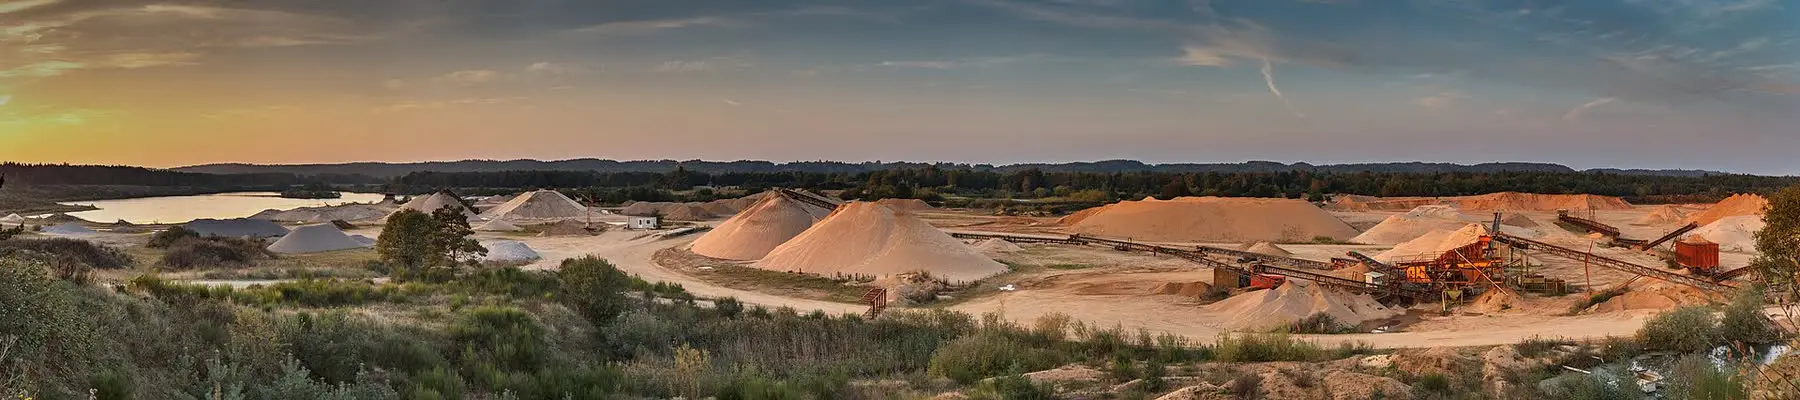
A gravel pit with many stockpiles. Photo: Slaunger, Wikimedia Commons, CC BY-SA 3.0. Shown for illustration; not a Laan Labs project.

A volume from a phone scan is only as good as the scan. Laan Labs builds the tool to make the limits visible rather than hide them.
- Capture the whole pile. A freestanding pile captured all the way round, with its toe and the ground beside it, gives a result far closer to a survey than any formula. A pile pushed against a wall or sitting in a bunker has faces the sensor cannot see; the tool shows the gap, and the operator decides whether the estimate is good enough for the purpose.
- Mind the sensor range. Phone LiDAR sees a few meters. A pile taller than that is captured by walking its slopes, or it is a job for photogrammetry from photographs or a drone, which Laan Labs' pipelines also support, with the same base-plane and outline measurement on the result.
- Watch the base. The base plane is the largest single source of error on sloped or uneven ground. The height map makes a poor fit visible before the number is read.
- Keep the loop short. Tracking drift grows with distance walked. For a large pile, several shorter scans or an aerial capture beat one long lap.
- Validate with known loads. The practical test is to scan a pile of known weight, apply the site's density factor and compare with the weigh ticket. That gives an observed accuracy for the material and the capture method, which is worth more than any vendor's general claim.
| Method | Fits | Trade-off |
|---|---|---|
| Walk-around formula | A rough check where a large error is acceptable | Assumes a shape the pile does not have |
| Phone LiDAR scan | Piles up to a few truckloads, bins and bunkers, anywhere the operator can walk | Depends on capture discipline; range limits tall piles |
| Photogrammetry from photos or a drone | Large piles and whole yards in one capture | Needs a pilot, planning and weather; processing takes longer |
| Fixed cameras or sensors | Bays with daily throughput that need a continuous figure | Installation cost; one location each |
| Professional survey | Stamped, defensible results for disputes and audits | Cost and lead time make it rare |
Most operations use more than one. The pattern Laan Labs builds for is a phone measurement whenever someone is at the pile, a drone or photogrammetry capture of the whole site on a schedule, and a survey when a number has to be defended.
Beyond the App: Volume Measurement in Your Own Pipeline
The volume tool shipped first as a feature for consumers and small contractors. For companies that need it inside their own operation, Laan Labs licenses the scanning and measurement technology and builds it into a workflow:
- Material and SKU density stored per product and per site, so every measurement reports tons as well as volume.
- Reports by site, product and date, exported as CSV or PDF, or pushed into the inventory, ERP or accounting system that closes the month.
- Change over time. Repeat scans of the same pile aligned to each other show production, consumption and shrink between measurements.
- Georeferenced piles. Each measurement tied to a GNSS position, so the same pile is found and compared on the next visit, with the RTK and AR workflow Laan Labs uses for site capture.
- Drone and photogrammetry capture for whole-yard inventories, and Gaussian splats when a photorealistic record of the yard is wanted alongside the numbers.
- Framework, source code or white-label app, following the same options as the 3D capture licensing Laan Labs offers for the rest of its scanning pipeline.
The first step is usually one site and one material: a week of phone measurements alongside the existing method, compared against weigh tickets, so the client sees the accuracy on their own piles before changing a process. See how Laan Labs works with construction and AEC, utilities and infrastructure and manufacturing and industrial clients, or contact us to talk about a project.
Technologies Utilized
iPhone and iPad LiDAR, ARKit, Metal, Mesh reconstruction, Base-plane fitting, Polygon clipping, Volume integration, Photogrammetry, Drone capture, Gaussian Splatting, GNSS, OBJ, PLY, LAS, DXF, CSV and PDF reporting
Download this article
Get the markdown source for offline reading