Open-Trench Scanning with GNSS, RTK and AR - Meeting Europe's Fiber Documentation Rules
Europe's fiber rollout now comes with documentation rules: where every duct lies, in coordinates, recorded before the trench is closed. This is how a phone, an RTK receiver and augmented reality do it in minutes.

Business Challenge
Fiber is going into the ground across Europe faster than it can be drawn. Trenches are getting narrower and shallower, crews move tens or hundreds of meters a day, and the trench is open for hours, not weeks. Once it is backfilled, the only record of what lies where is whatever was written down while it was open.
For a long time that record was a sketch and a few tape measurements to the kerb. That is no longer enough. The rules that now govern fiber construction in Germany, and infrastructure information across the EU, ask for something specific: the position of the line in coordinates, at a stated accuracy, in a form a GIS can read.
The requirement is accurate, georeferenced as-built documentation, recorded before the trench is backfilled
What the Rules Ask For
Three rules are often mentioned together. They say different things.
| Rule | What it covers |
|---|---|
| Germany: DIN 18220 (August 2023) | The standard for trenching, milling and ploughing methods for fiber-optic cables and ducts. It calls for survey data on the x, y and z axes at intervals of no more than 20 m, details of what was installed, and documentation in a GIS-compatible format. For shallow installations in the roadway, the maximum standard deviation is reduced to 5 cm. |
| Germany: Telecommunications Act, section 127(8) | The road authority may attach conditions to its consent, including documentation of the position of the telecommunications line in geographic coordinates, as is usual in that authority's area. |
| EU: Gigabit Infrastructure Act, Regulation (EU) 2024/1309, Article 4 | Operators must make information about existing physical infrastructure available, including its georeferenced location and route. |
The German government's application guide for DIN 18220 describes surveying while the trench is still open, with a standard deviation of 10 cm in general and 5 cm for the shallow roadway installations mentioned above.
Two points are worth being exact about. None of these rules prescribes a particular technology: they do not say GNSS, and they do not say augmented reality. And DIN 18220 is a technical standard, not a law in itself. It becomes binding through contracts, funding conditions and permit conditions, and it informs what counts as accepted technical practice.
What the rules have in common is the outcome they expect: a record of the line in real coordinates, at centimeter-level accuracy, that someone else can load into their own system. That is very hard to produce with a tape measure, and it cannot be produced at all after the trench is closed.
Sources: Gigabitbüro des Bundes on DIN 18220, application guide for DIN 18220, TKG section 127, Regulation (EU) 2024/1309 and DIN on the legal status of standards. This is a summary for orientation, not legal advice. The requirements of a given project are set by its contract and its permit.
Approach: Scan the Trench While It Is Open
Laan Labs' approach puts the survey in the hands of the crew that is already there. The equipment is a phone or tablet with LiDAR and an RTK GNSS receiver on a pole.
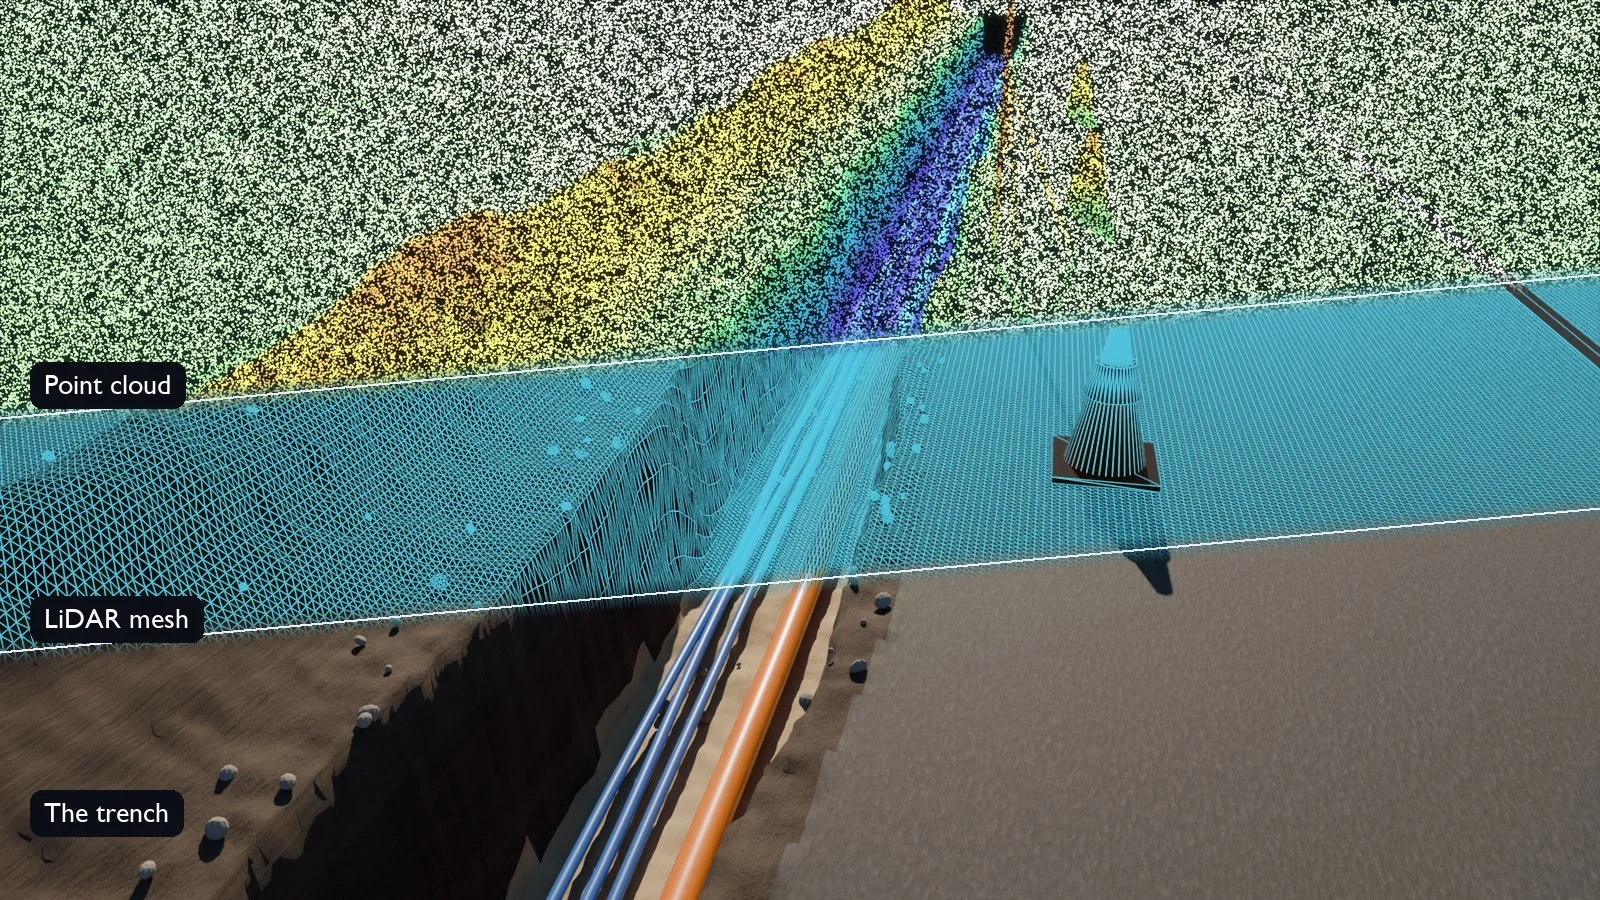
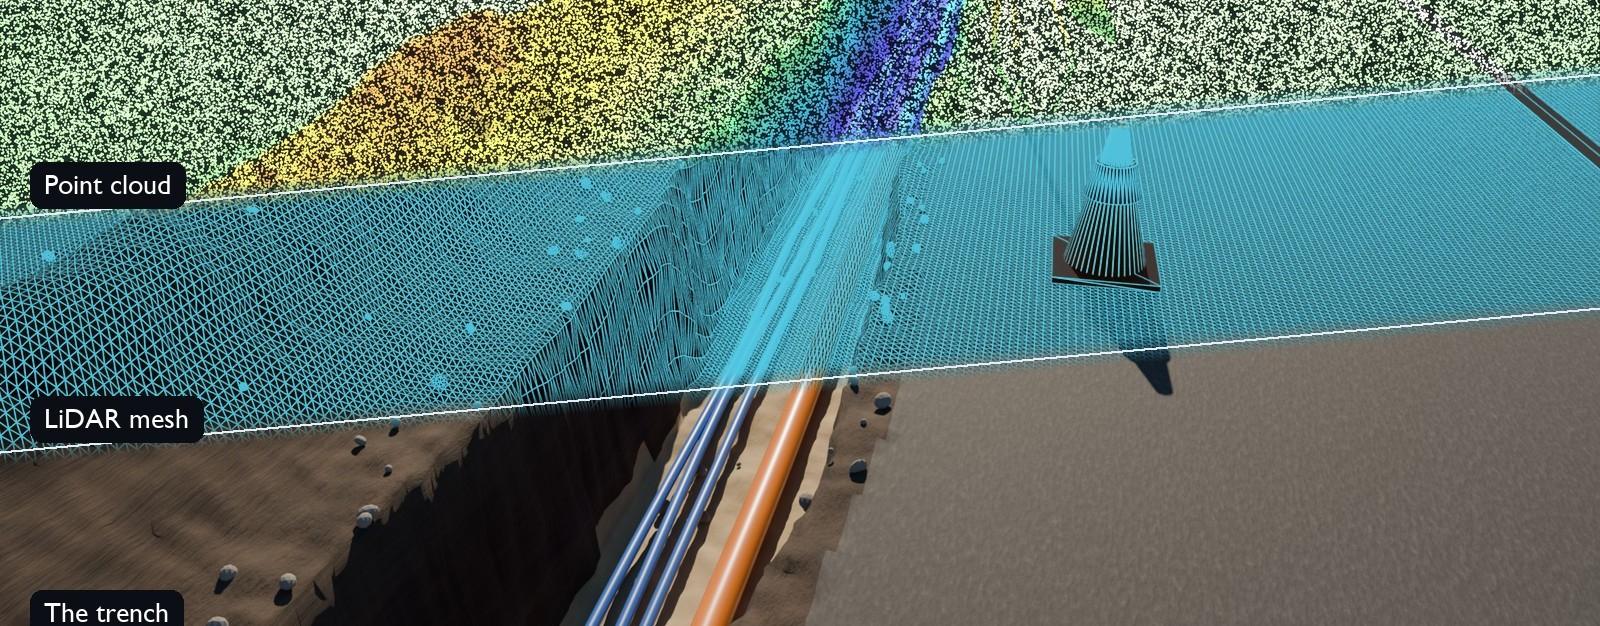
Illustration: the same trench as it looks, as a LiDAR mesh, and as a point cloud colored by depth
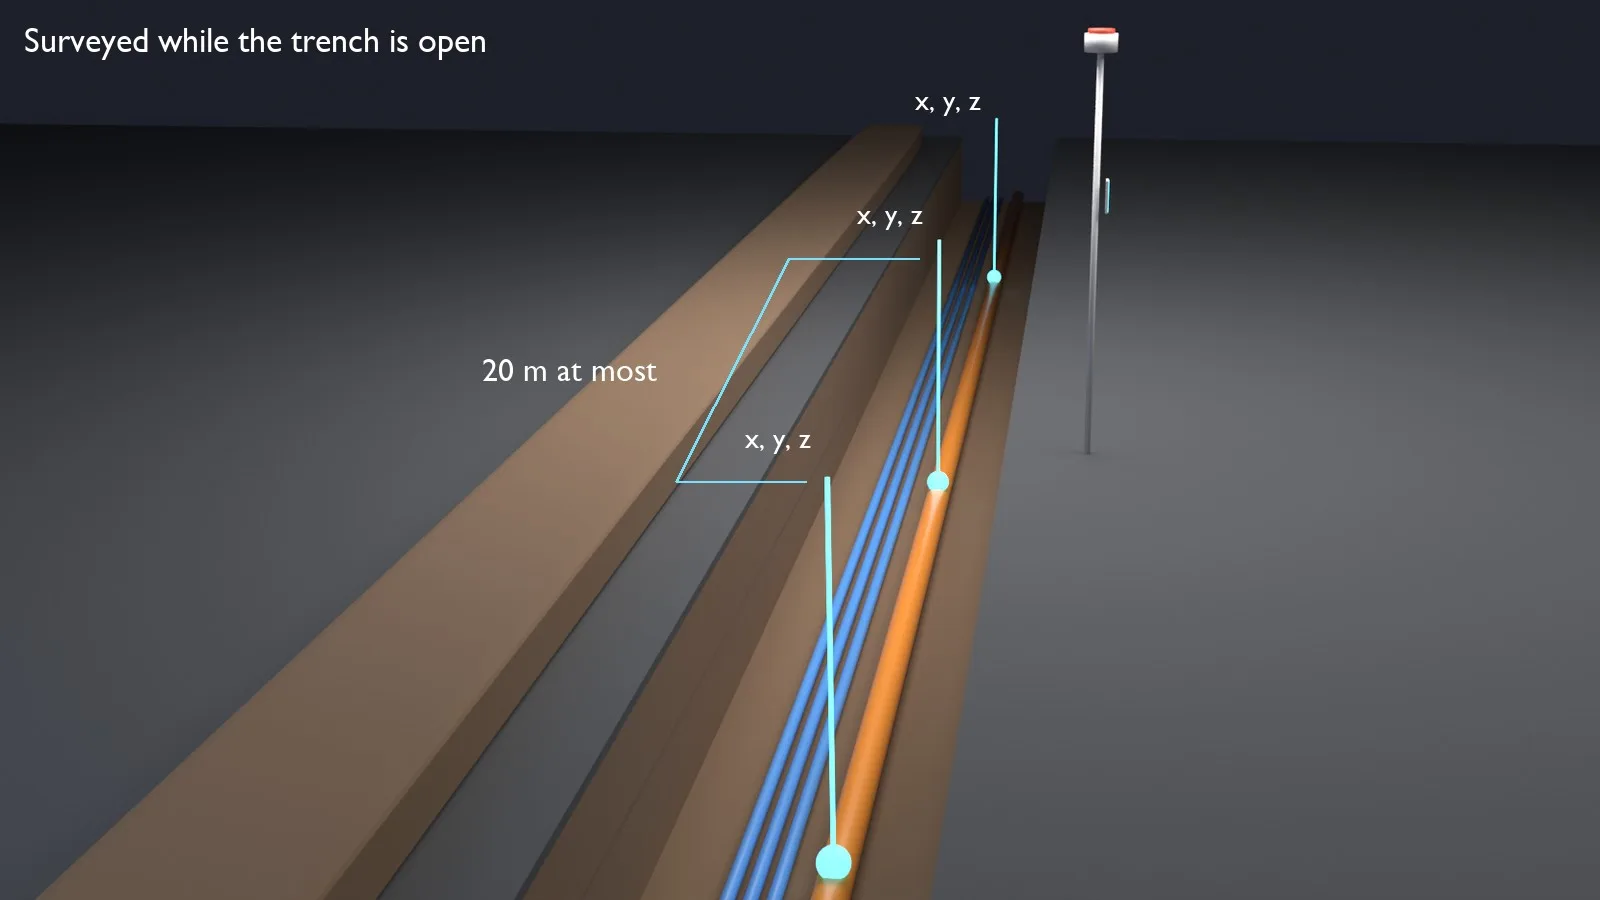
Illustration: surveyed points along the duct, taken with an RTK rover before backfilling
- Get a fix. The receiver connects to the phone and to a correction service over NTRIP. With an RTK fix and a clear view of the sky, a survey-grade receiver typically estimates its own position to 1 to 3 cm. That is the receiver's estimate for its antenna, not the accuracy of the finished record, which is covered under What Accuracy Means Here.
- Survey the line. Points are taken on the duct at each change of direction and at intervals along the run, well inside the 20 m maximum. Each point carries x, y and z, its fix state and its estimated accuracy.
- Scan the trench. An iPhone LiDAR scan records the trench itself: the ducts, the fittings, the depth of cover, crossings with other utilities and the surroundings. The scan is aligned to the surveyed points, which places it in real coordinates, and the residual of that alignment is stored with it.
- Add what was installed. Duct type, count and dimensions and the laying method are recorded with the organization's own feature codes, alongside photographs.
- Check it. Check shots against known control points measure the horizontal and vertical error on the day, independently of what the receiver reports, and the residuals travel with the data.
- Export. The line, the points and their attributes go out as GeoJSON, CSV, DXF or LandXML in the project coordinate system, ready for the GIS of the network owner or the road authority.
The sequence is designed to take minutes per section, so that it fits between laying and backfilling. How long it takes on a given job depends on the section length, the number of crossings and how quickly the receiver holds a fix, and is something to measure in a pilot.
What Accuracy Means Here
A figure from the receiver is not the accuracy of the record. Several things sit between the two, and each has to be controlled and checked:
| Source of error | What controls it |
|---|---|
| Receiver position | RTK fix state, satellite geometry, sky view, multipath near walls, vehicles and trees |
| Antenna offset | Pole height and the measured offset from the antenna to the pole tip |
| Pole tilt | Holding the pole plumb, or a receiver with tilt compensation |
| Phone to antenna offset and orientation | The measured lever arm between the phone's camera and the antenna, and the heading used to apply it |
| Scan drift | Phone tracking drifts over distance, so long sections need surveyed points along them, not only at the ends |
| Alignment | How well the scan fits the surveyed points; reported as a residual, which measures the fit and not the positional accuracy |
| Coordinate system | The transformation from GNSS coordinates to the project system, and the height reference used |
| AR display | All of the above, plus the phone's compass and tracking at the moment of viewing |
For that reason the workflow reports three things separately, and none of them is assumed from another:
- Surveyed points: the receiver's own estimate for each point, and the error measured by check shots on control.
- The scan: the residual of its alignment to the surveyed points, and distances in the scan compared with distances measured on site.
- AR overlays: a finding aid with a wider uncertainty than the stored coordinates, shown as such.
Whether a job meets a 5 cm or 10 cm requirement is established by those checks on that job, in horizontal and vertical terms, and not by the specification of the receiver. This case study describes the method. It does not report results from a field trial; a pilot on a real section, measured against independent control, is the first step Laan Labs recommends.
The iPhone LiDAR Scan
A list of coordinates says where the line is. The scan shows what was there. The LiDAR sensor on an iPhone Pro or iPad Pro measures depth directly, several meters out, and the phone fuses it with its camera images as the operator walks the trench. A section is captured in the time it takes to walk it, with no tripod, no targets and no second person.
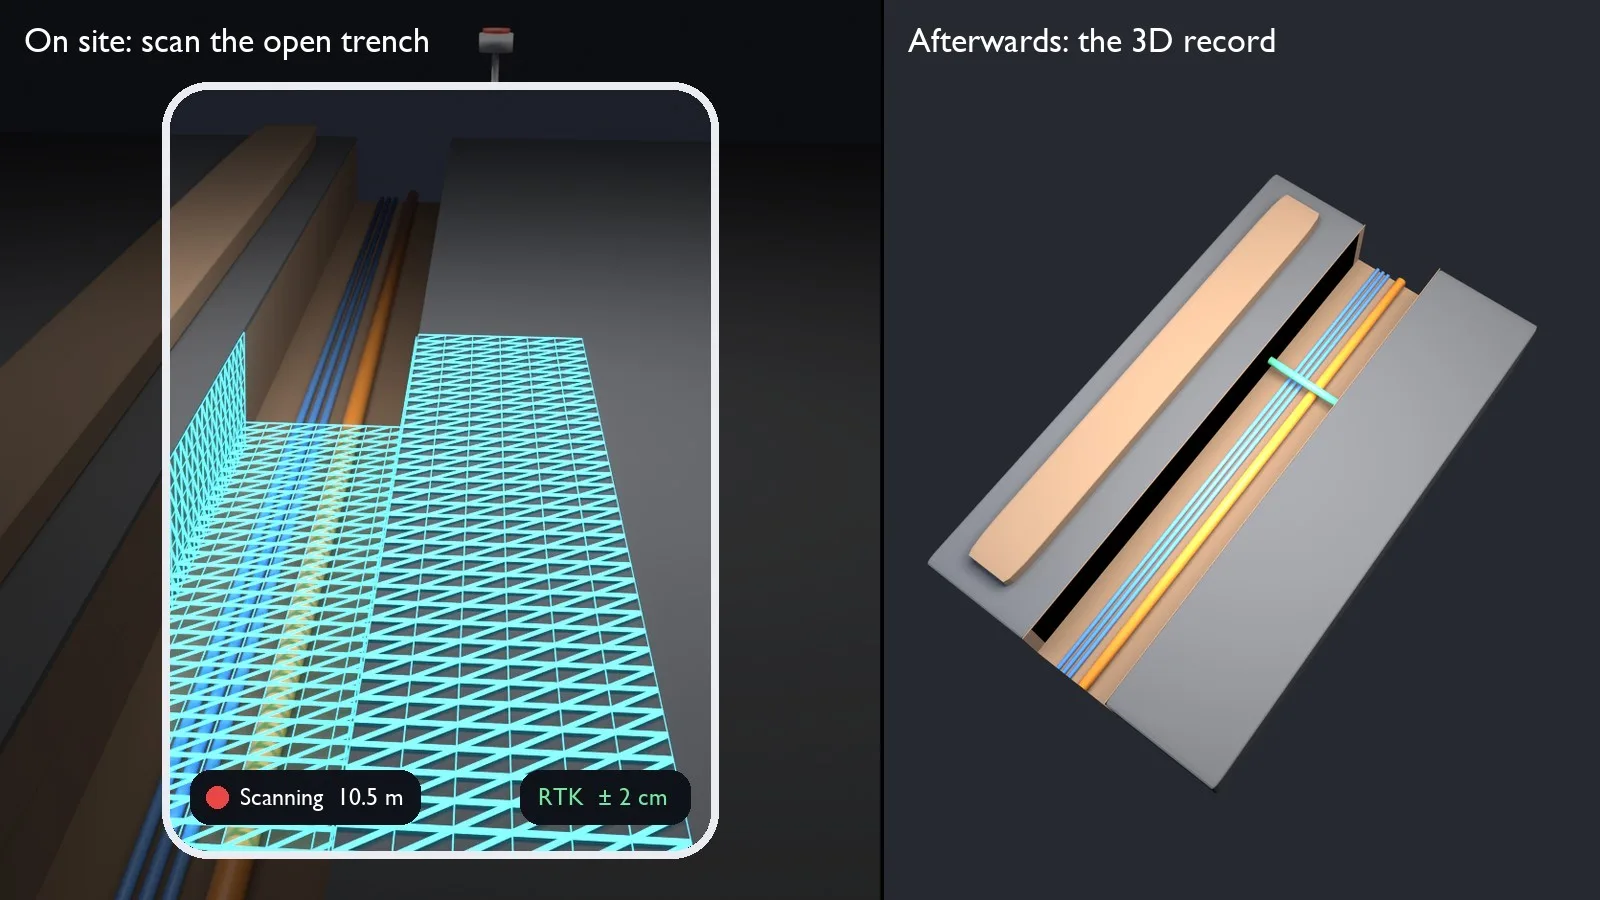
Illustration: the scan forms on screen as the operator walks the trench, and becomes a 3D record of that section
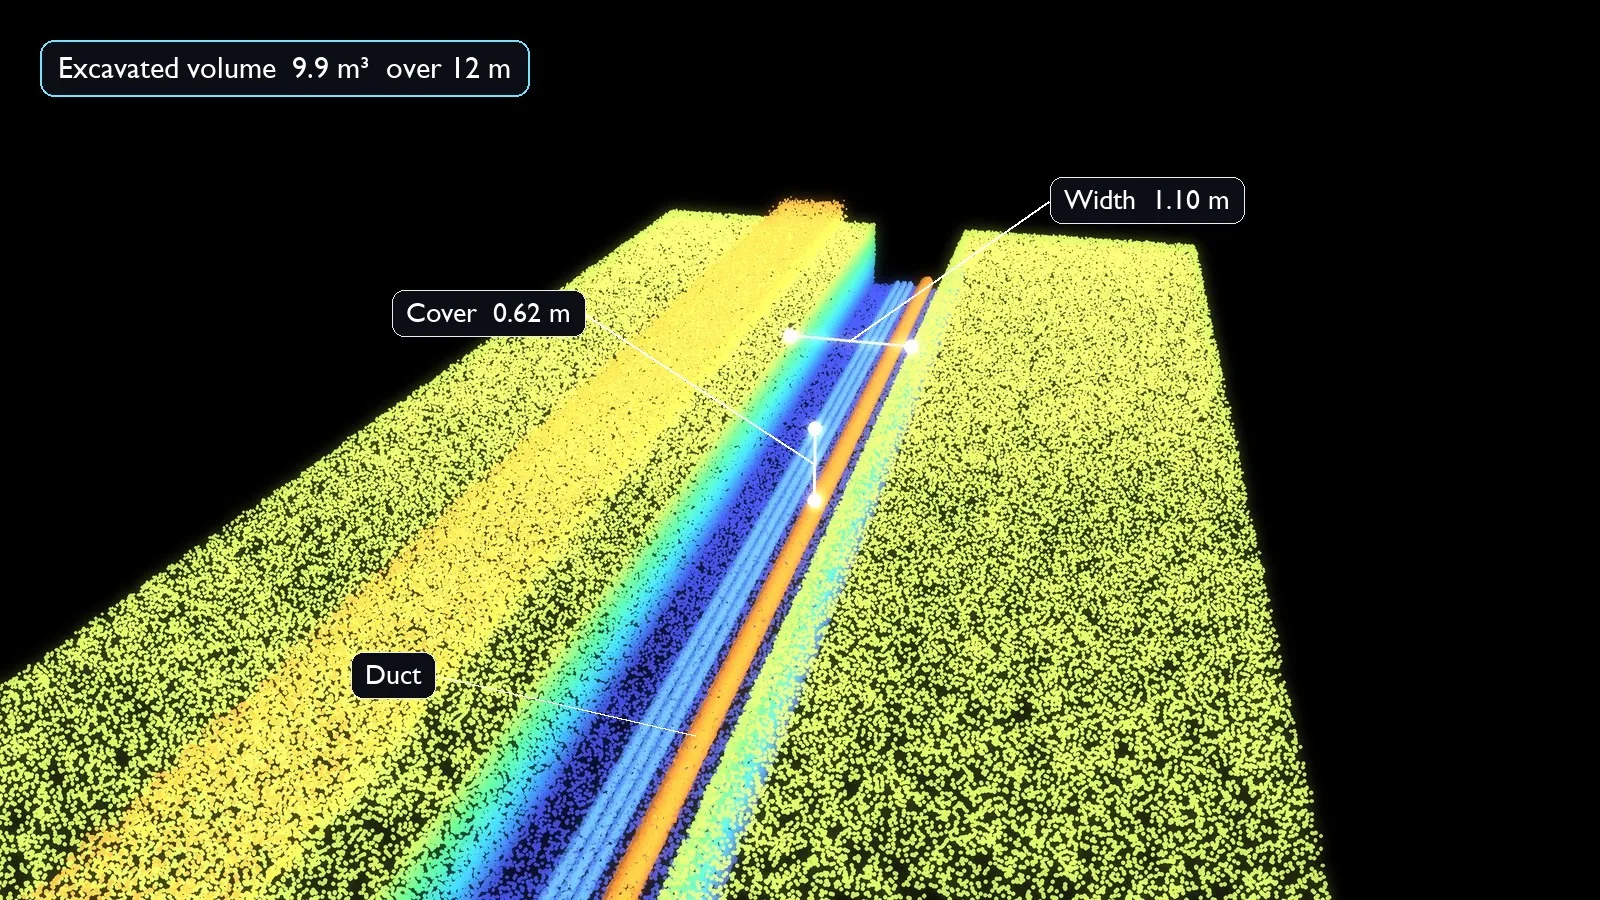
Illustration: a trench scan as a point cloud, colored by depth, with measurements taken on it
The result is a dense, colored point cloud and a textured mesh of the open trench:
- It records what the scanner could see. Ducts, fittings, bedding, crossings with other utilities, the trench walls and the surface on either side, as far as the operator covered them. Anything hidden under another object, under water or behind the trench wall is not in the scan, so coverage is checked on screen before leaving.
- It is measurable afterwards. Depth of cover, trench width, the spacing between ducts and the clearance to a crossing pipe are taken from the scan in the office, months after backfilling.
- It is georeferenced. Aligned to the RTK points, the cloud is placed in real coordinates, so the scan drops into a GIS or a CAD drawing in position. How accurate that position is comes from the independent checks described under What Accuracy Means Here, not from the alignment itself.
- It copes with shade and bare soil. LiDAR measures depth with its own infrared light, so the geometry of a shaded trench with plain earth walls still scans where photographs alone would struggle. Color and texture still need light, range is limited to about 5 m, and strong sunlight, standing water and wet or very dark surfaces reduce the quality of the depth data.
- It exports in standard formats. Point clouds as LAS, PLY and E57, meshes as OBJ, alongside the surveyed line.
Over a few meters, the geometry of a phone LiDAR scan is typically good to around a centimeter under good conditions. Over a longer walk the phone's tracking drifts, which is why sections are kept short and tied to surveyed points along their length. The absolute position comes from the receiver and the alignment, not from the phone.
Crossings and Junctions
Straight runs are the easy part. The places that cause trouble later are the ones where utilities meet: a fiber duct bending into a pit, a water main passing beneath it, a power cable crossing at an angle. A scan records all of them together, in one coordinate frame, with the clearances between them.
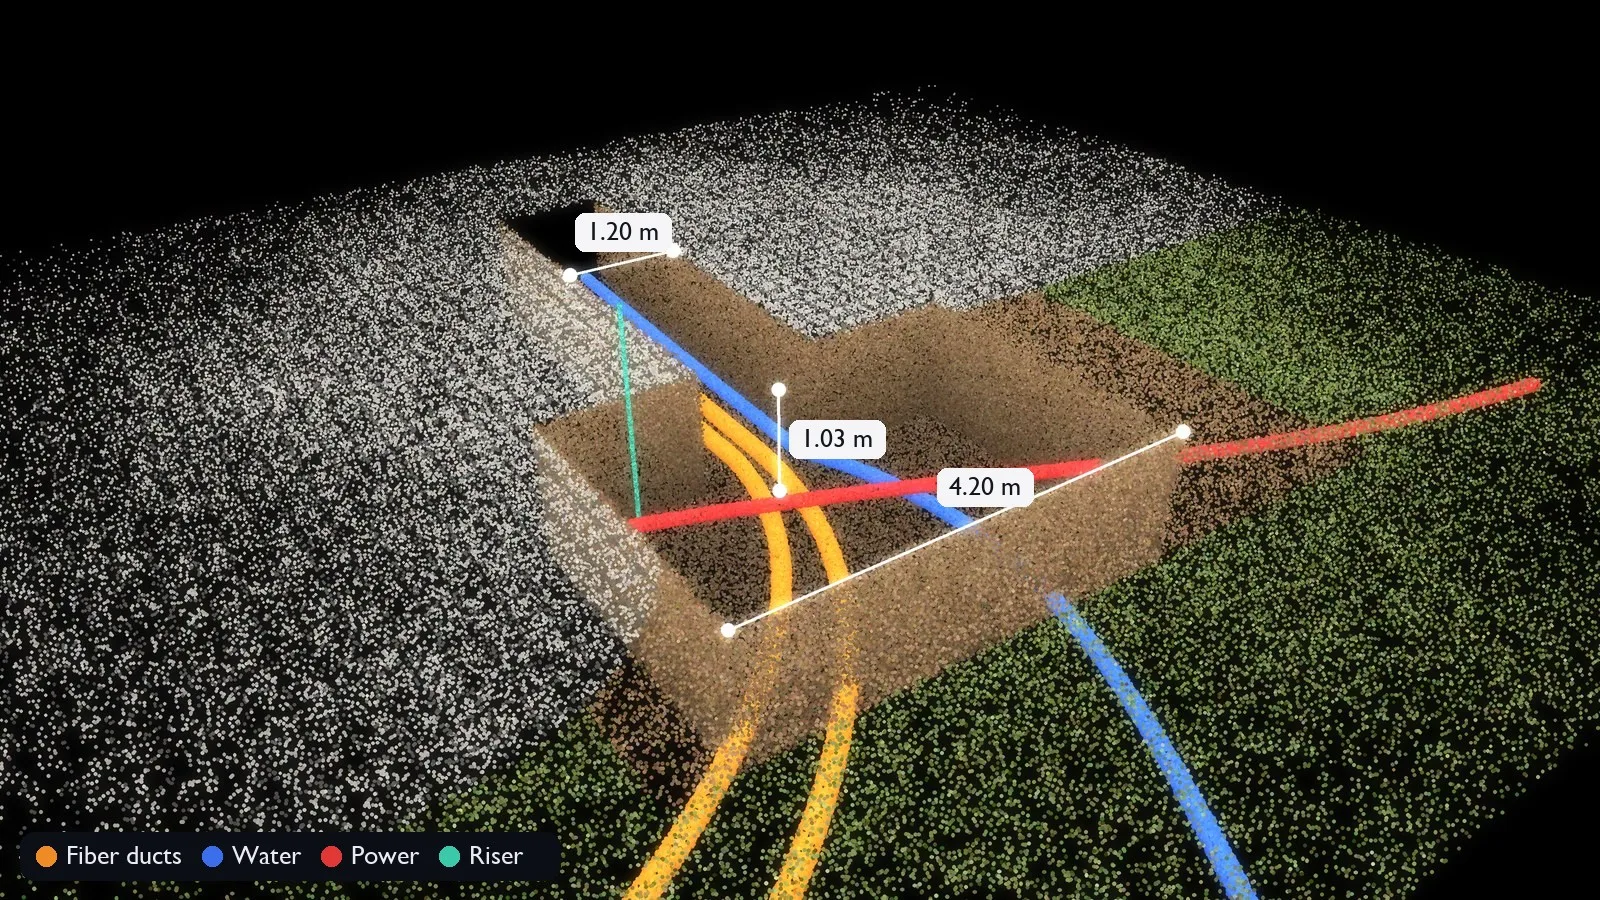
Illustration: an excavation scanned as a point cloud, with the utilities that cross in it and measurements taken on the scan
Volume Measurement
The same scan measures volume. Laan Labs built volume measurement into 3D Scanner App, the LiDAR scanning app it created, and the method applies directly to trench work: the scanned surface is closed against a reference plane and the enclosed volume is calculated.
For a trench that gives the excavated volume between the original surface and the trench floor, section by section. For the spoil heap beside it, the volume of material removed. Both are numbers a contractor otherwise estimates: for backfill and bedding quantities, for disposal, and for billing work by the cubic meter with a scan to support the figure.
Gaussian Splats for Fine Detail
LiDAR gives geometry and scale. It does not resolve the print on a duct, the label on a joint closure or the condition of a cable sheath. For that, the same site visit adds a Gaussian splat.
The operator takes a short video or a set of photographs along the trench with the phone. Those images are reconstructed into a splat: a photorealistic 3D scene that can be looked around from the viewpoints the capture covered. Close to those viewpoints it holds much of the detail of the photographs; away from them, and for areas photographed from one side only, quality falls off. Thin objects, wet and reflective surfaces and tangled cables, which a LiDAR mesh smooths over, are reproduced better than in a mesh.
Illustration: from point cloud to Gaussian splat as training refines the scene
- See what was installed. Color codes and warning tape show clearly. Printed duct markings and labels are legible only where the camera came close enough and the light was good, so the original photographs are kept with the record at full resolution, each tied to where it was taken. For reading a marking, the photograph is the evidence and the splat is the way to find it.
- See condition. Joints, seals, bedding and the state of existing utilities at a crossing are recorded as they were found.
- Geometry and appearance together. The splat is aligned to the LiDAR scan and the RTK points, so it sits in the same coordinates. Measurements are taken from the scan and the surveyed points; the splat is for looking, not for measuring.
Processed on a Mac
Splat training usually means uploading the imagery to a cloud GPU. Laan Labs runs it on a Mac. Its own trainer is written in Metal for Apple Silicon, the same engine behind 3D Splat App, so a day's captures are processed on a laptop in the site office or back at the depot, and the imagery never leaves the organization. That matters for infrastructure records, which many owners are not free to send to a third-party cloud.
The finished splat is compressed and opens in a browser next to the scan and the surveyed line. See Gaussian splat training on Mac with Metal and Gaussian splatting and radiance fields.
Receivers
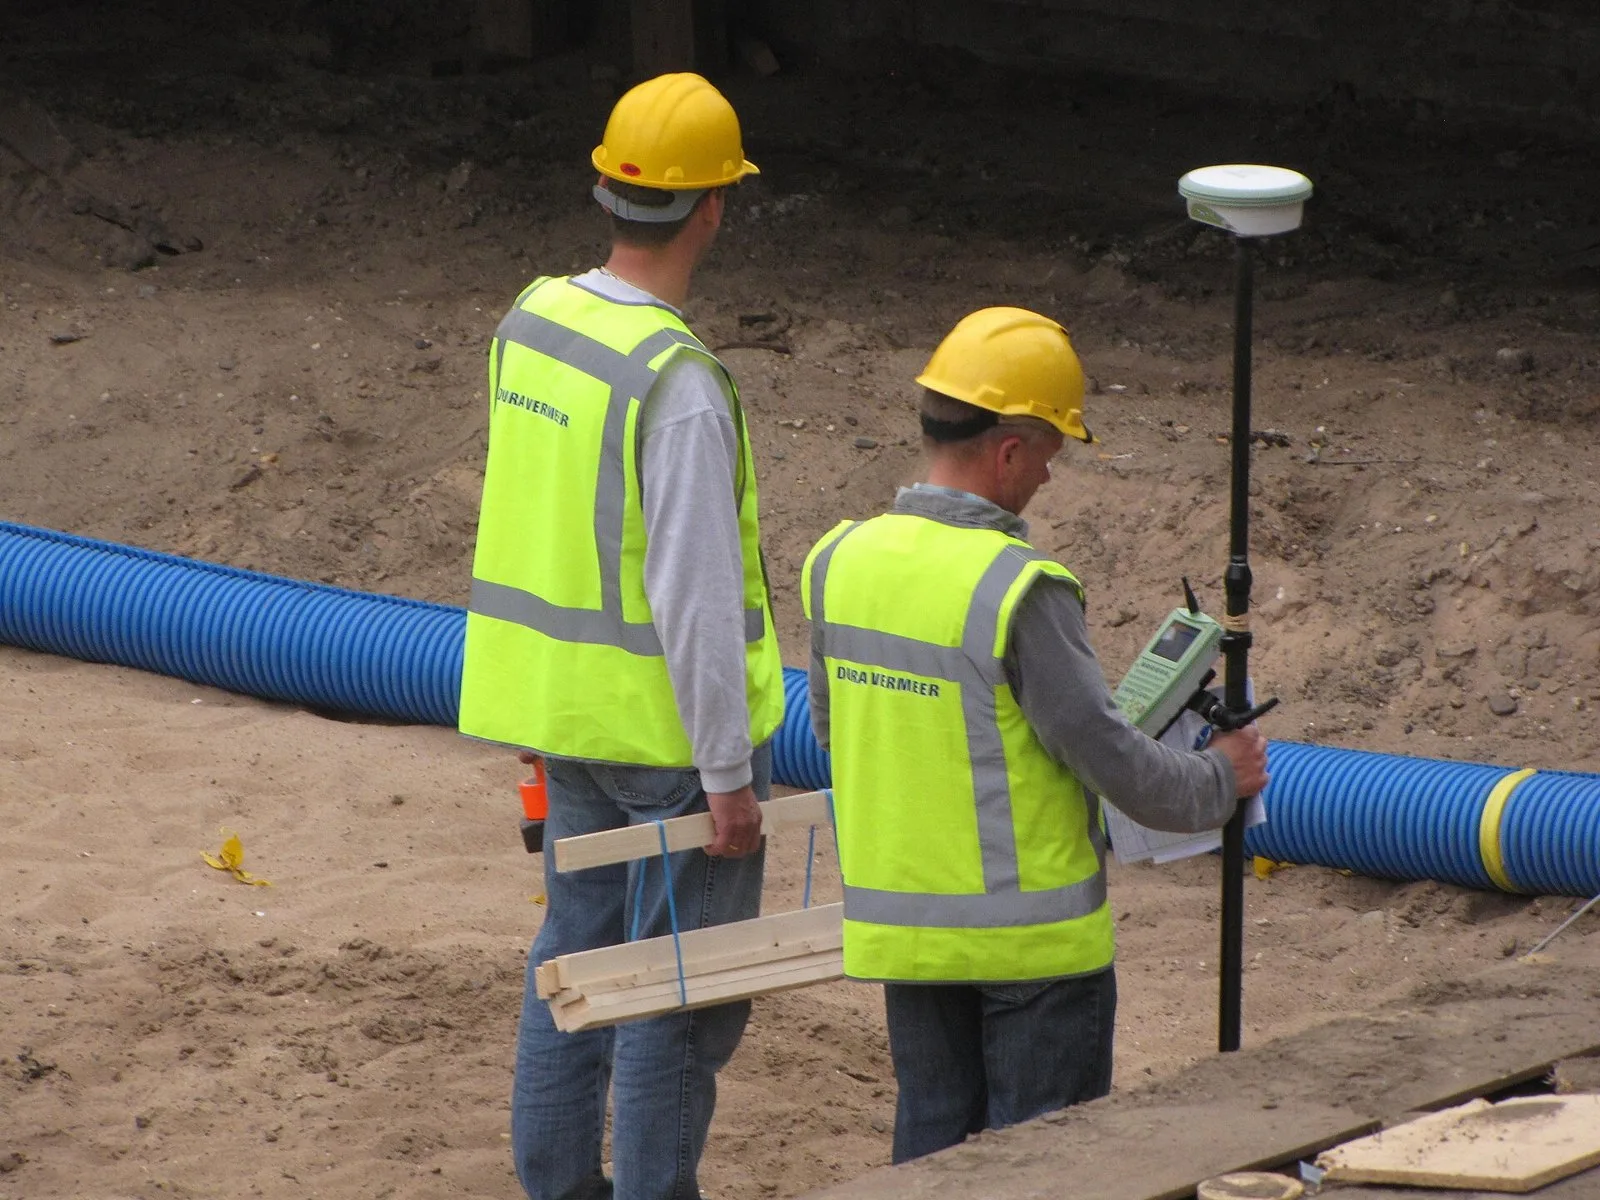
A GNSS rover in use beside a pipe before backfilling. Photo: JoeNomi 1961, Wikimedia Commons, CC BY-SA 3.0. Shown for illustration; not a Laan Labs project.

The workflow is receiver-agnostic. Laan Labs has integrated GNSS equipment from Emlid, Leica Geosystems, Trimble and Bad Elf, among others. Receivers connect over Bluetooth or Wi-Fi, standard NMEA output is read directly, and NTRIP corrections are applied for RTK.
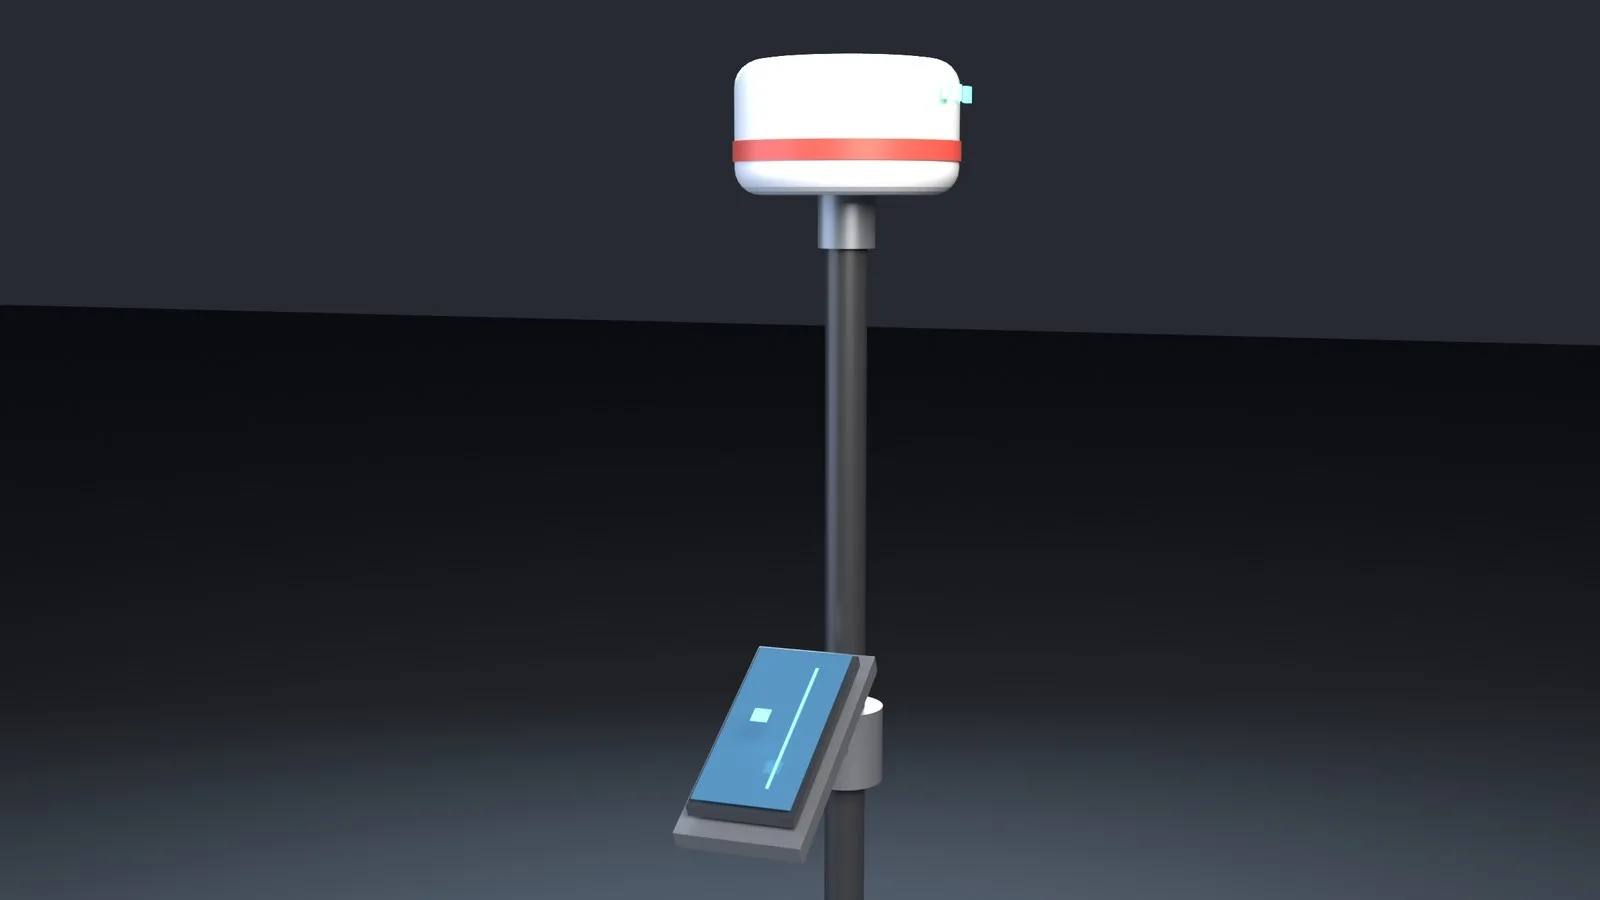
Illustration: the phone rides on the pole below the receiver, so one person surveys, scans and checks the result
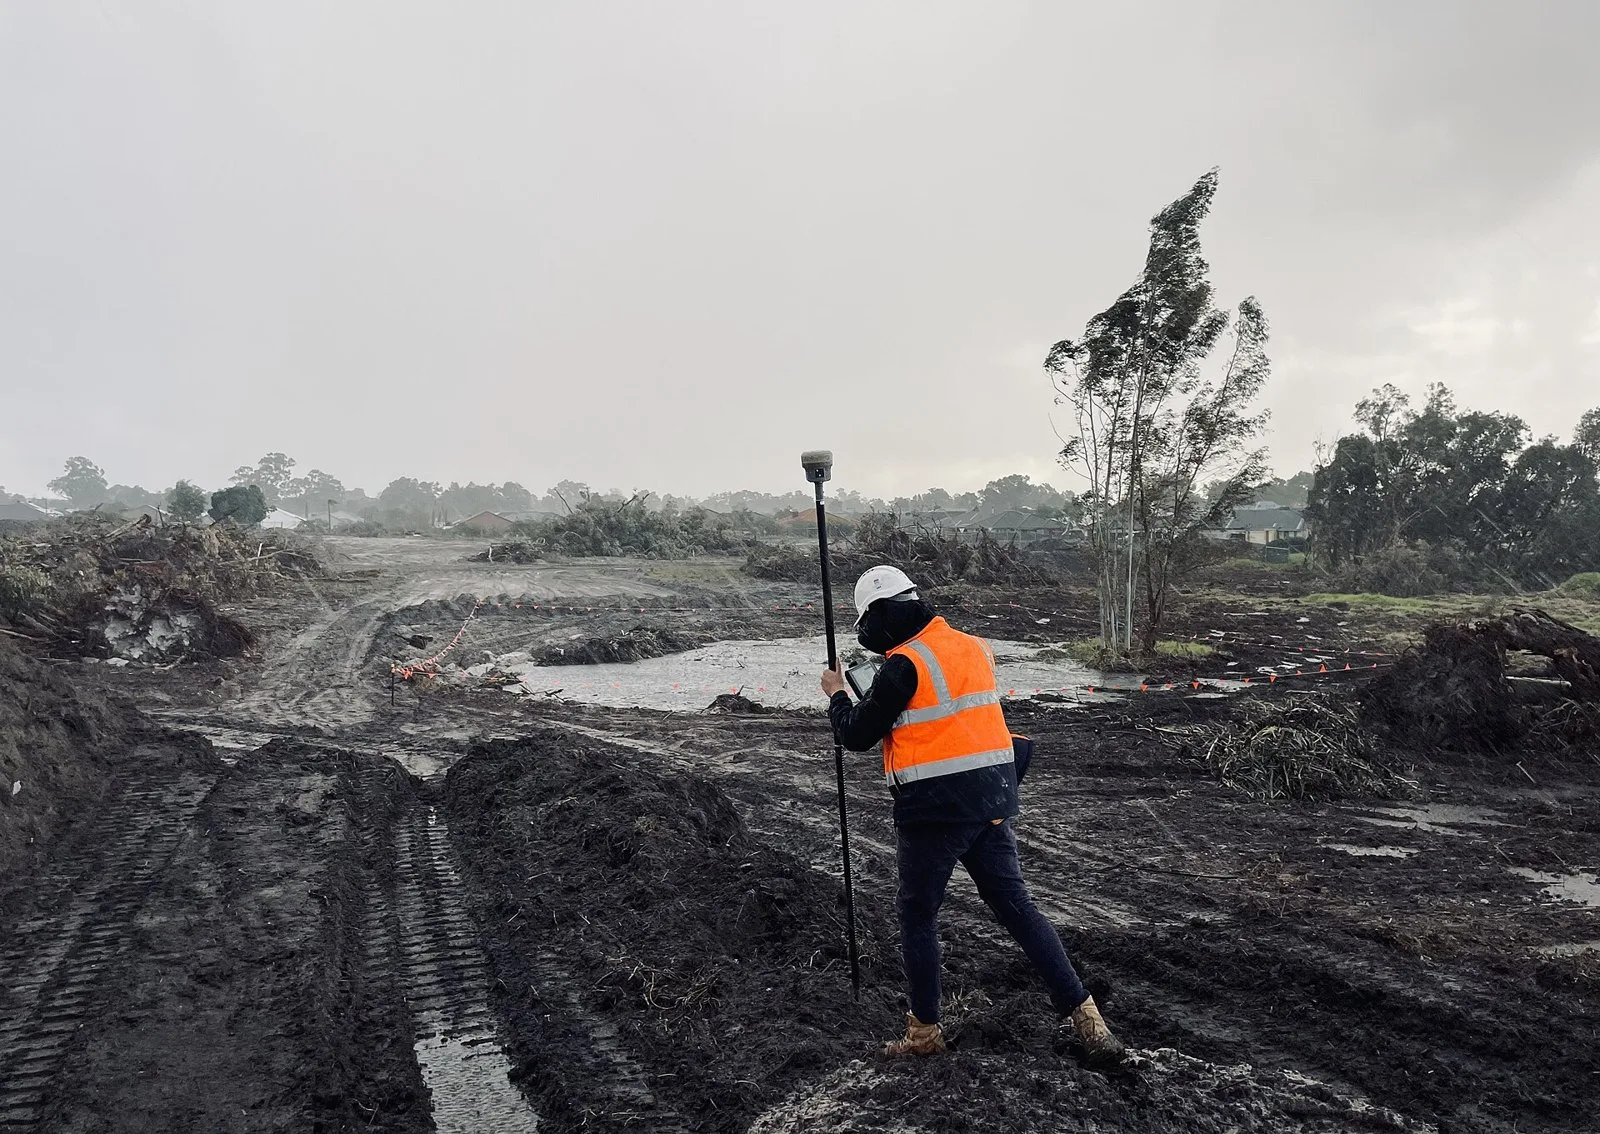
An RTK rover on a development site. Photo: Cvstr, Wikimedia Commons, CC BY 4.0. Shown for illustration; not a Laan Labs project.

The position source is always shown for what it is. A centimeter-grade RTK fix, a sub-meter receiver and the phone's own location are never presented the same way, and an observation taken without a fix is marked as such. A record that claims 5 cm has to be able to show it, with check shots and not only with the receiver's own estimate.
Augmented Reality, Before and After Backfill
Augmented reality runs through the whole workflow, not only at the end. The phone knows where it is from the receiver and how it is oriented from its own tracking, so anything with coordinates can be drawn in place over the camera view.
While the Trench Is Open
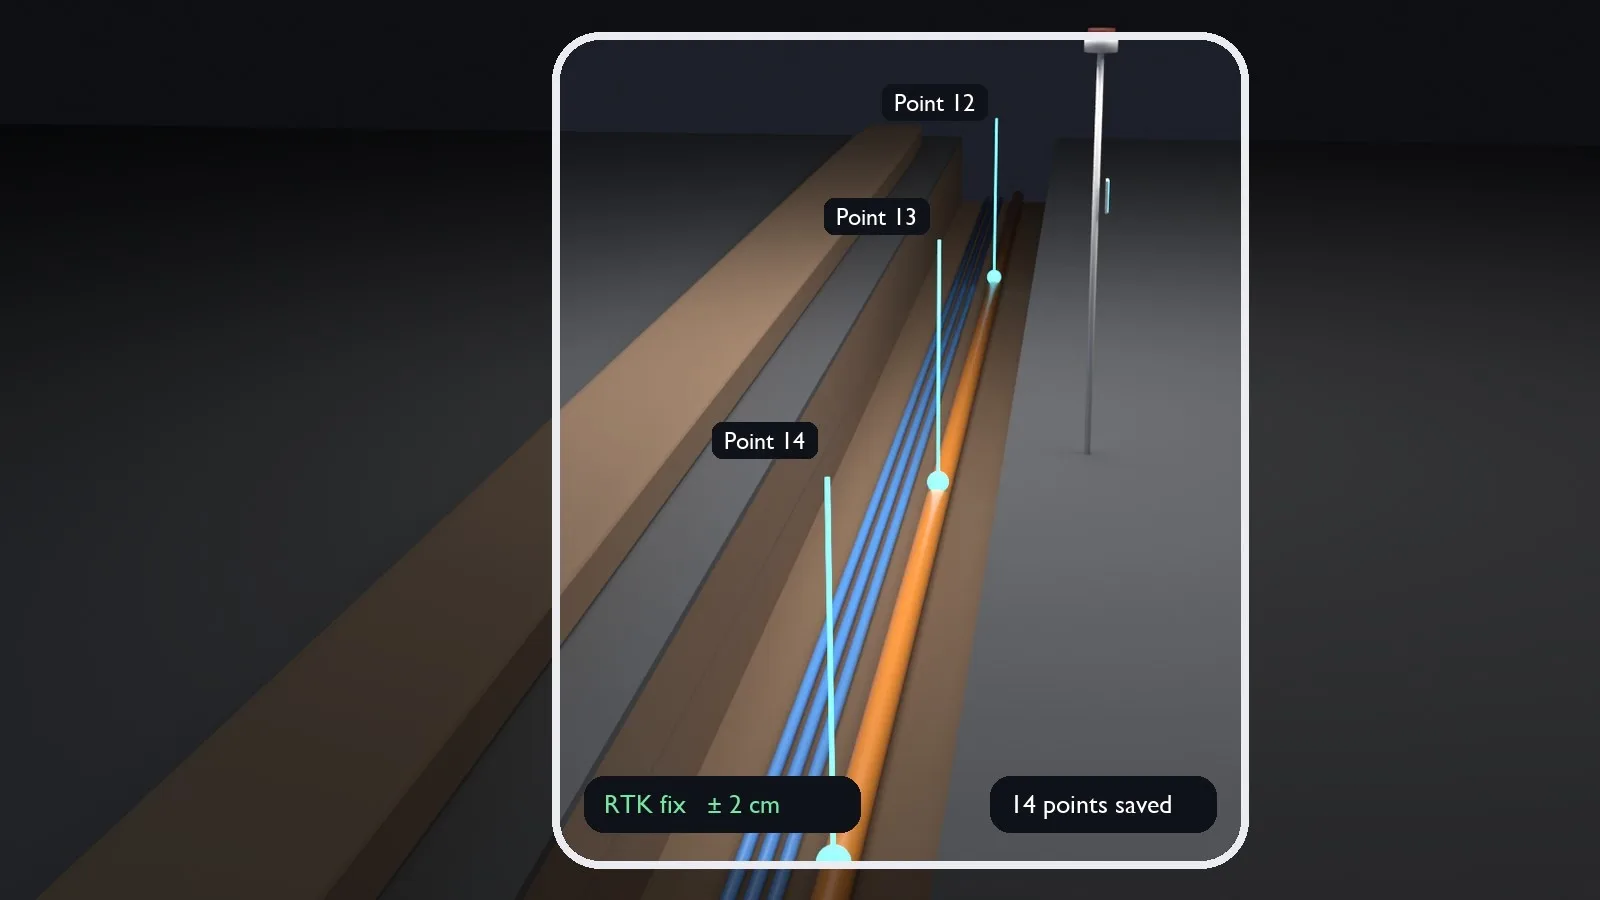
Illustration: surveyed points shown in place during capture
- See what has been surveyed. Each point appears on the duct where it was taken, so a missed bend or a gap longer than 20 m is obvious before the crew moves on.
- See what has been scanned. The scan is drawn over the trench as it grows, showing which stretches are covered and which still need a pass.
- See the design. The planned route and existing utilities from the GIS are shown on the ground ahead of the excavator, so a deviation from the design is noticed while it can still be recorded, or corrected.
- Know the fix. RTK status and the receiver's estimated accuracy stay on screen, so nobody records a point on a degraded position without knowing it.
Overlays are less exact than the coordinates behind them. They depend on the phone's heading and tracking as well as on the receiver, so an overlay is a guide to where to look and a check that nothing was missed, not a measurement.
After the Trench Is Closed
The record matters most on the day someone has to dig there again. With the line stored in real coordinates, AR shows it in place: the route drawn on the ground through the phone's camera, with distance to the nearest point and its recorded depth.
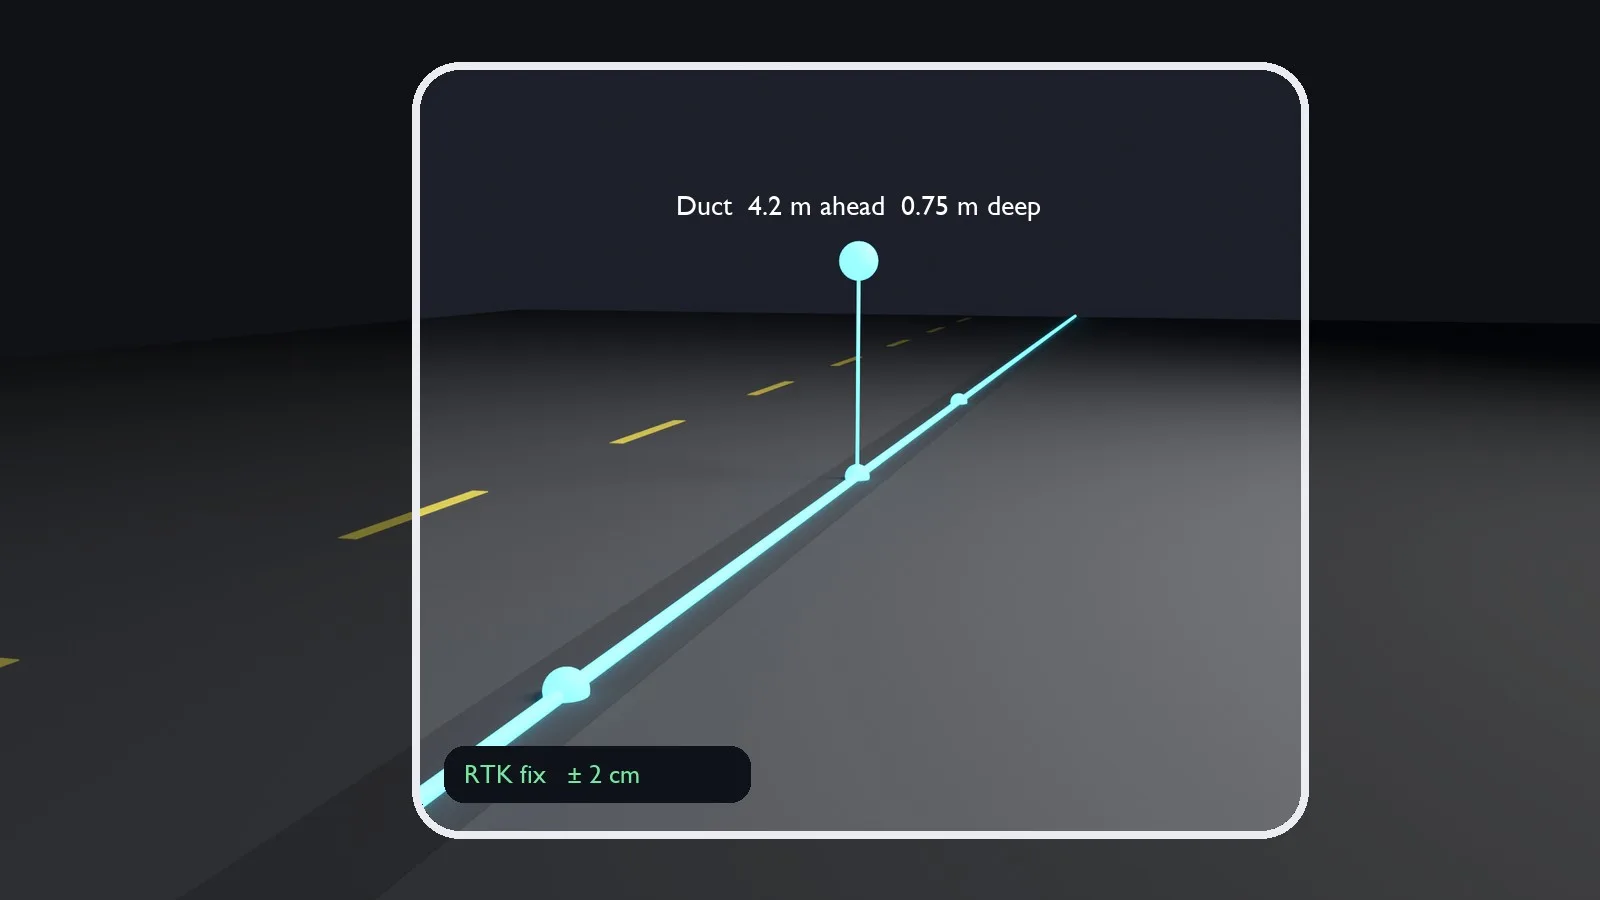
Illustration: the recorded route shown in place over the closed surface
- Walk to the asset. Bearing and distance lead a crew to a joint, a duct end or a crossing without hunting for it.
- Look into the ground. The scan of the open trench can be shown where it was captured, so the crew sees what is under the surface before breaking it.
- Brief anyone. A site manager, a road authority inspector or a neighboring utility sees the route on site, without reading a drawing.
AR is a finding aid. It shows where the record says the line is, with the uncertainty of the record, the GNSS position and the phone's heading behind it. It does not replace utility locates or safe digging procedures.
Why Act Now
- The window is short. Documentation to this standard can only be captured while the trench is open. A method that needs a survey crew to be booked can be difficult to coordinate within that window.
- It is increasingly a condition. Of the permit, of the contract, and of funding. Work that cannot be documented to the required accuracy risks rework, delayed acceptance and delayed payment.
- The information has to be shareable. Infrastructure owners are expected to provide the georeferenced location and route of what they own. Records that start out as GIS data do not have to be digitized later from sketches.
- A good record lowers risk later. A crew that knows where a line was recorded, and how reliable that record is, spends less time searching and is less likely to hit it. It lowers the risk; it does not remove it, and locating before digging still applies.
A phone and a receiver, used with a checked procedure, can make that documentation a routine part of laying the line.
Start with a Pilot
The practical first step is one crew and one real section of trench, surveyed with the client's own receiver and checked against independent control. That shows what accuracy the procedure delivers on site and how it fits between laying and backfilling.
Laan Labs builds the workflow around an organization's own feature codes and coordinate systems, integrates it with a GIS or asset management platform, or delivers it as a dedicated application. See how Laan Labs works with utilities and infrastructure, or contact us to talk about a project.
Technologies Utilized
RTK GNSS, NTRIP, iPhone LiDAR, Point clouds, Gaussian Splatting, Metal, Volume measurement, Photogrammetry, ARKit, Augmented Reality, GeoJSON, DXF, LandXML, LAS, E57
Download this article
Get the markdown source for offline reading